VTS vs VGS: Which ETF Is Has The Best Growth?
Last Updated on 12 March 2024 by Ryan Oldnall
The US stock market saw a robust performance in 2023, achieving a total return of 26.29%, rebounding from a -18.11% decline in 2022 [1]. Over the past decade, the S&P 500 has delivered an annualized return of 16.40%, whereas the ASX200 has recorded a 10-year annualized return of 8.01% [1][2].
New investors exploring ETFs are looking for opportunities to invest their money but may not want to allocate all their assets to a single basket like the S&P 500. An alternative option is available in the form of the Vanguard MSCI Index International Shares ETF, VGS.
VGS tracks in the MSCI World Ex Australia, which essentially means it offers global exposure while intentionally excluding the Australian share market. The MSCI World Ex Australia has achieved a 10-year annualized total return of 12.31% [3].
In this article, we will examine the performance of both VTS and VGS using data from Yahoo Finance and Morningstar, illustrating areas where these ETFs may overlap and where they exhibit distinct differences.
VTS and VGS Review
Vanguard, a highly regarded investment management firm, has had significant influence in the Australian market since its establishment in 1996.
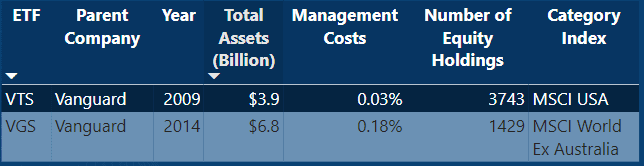
Serving over 50 million investors globally, Vanguard manages a total of over A$10 trillion in assets, with its Vanguard US Total Market Shares Index ETF (VTS) alone overseeing $3.6 billion [6][7].
Introduced in May 2009, the Vanguard US Total Market Shares Index ETF, VTS provides investors with access to approximately 4,000 US-listed companies, aiming to mirror the performance of the Center for Research in Security Prices (CRSP) US Total Market Index before fees and taxes[7].
One notable distinction between VTS and many other ASX-listed ETFs is its country of domicile. VTS is domiciled in the US, a factor that alone dissuades many investors from selecting VTS and prompts them to explore alternatives like IVV, which focuses on the S&P 500.
One notable distinction between VTS and many other ASX-listed ETFs is its country of domicile. VTS is domiciled in the US, a factor that alone dissuades many investors from selecting VTS and prompts them to explore alternatives like IVV, which focuses on the S&P 500.
I won’t delve into the intricacies of domicile and taxes in this piece. However, you can explore some valuable resources to learn more: Morningstar’s insights on Tax Implications of Overseas Investing and Owen Rask’s breakdown of USA domicile tax on BestETFs.
Vanguard MSCI Index International Shares ETF, VGS, was initially introduced on November 18, 2014, and presents a distinct ETF compared to VTS. VGS aims to mirror the return of the MSCI World ex-Australia and offers exposure to numerous major developed countries’ largest companies.
VGS invests in approximately 1,500 companies from developed countries, excluding Australia. It includes companies from about 23 different countries, such as the US, Japan, UK, Canada, France, and Switzerland [8].
In terms of size, VGS is substantially larger than VTS, with $6.8 billion invested in the ETF compared to VTS’ $3.9 billion. However, even combined, both ETFs still fall short of Australia’s largest ETF, Vanguard Australian Shares Index ETF, VAS.
VTS and VGS ETF Management Fees
Management fees or Management Expense Ratios (MERs) are pivotal factors when considering ETF investments. ETFs strive to mirror their underlying indices before factoring in fees, expenses, and taxes. Thus, it’s important to identify ETFs that track your desired index efficiently while maintaining reasonable costs.
In comparing the management fees of VTS and VGS, VTS emerges as significantly more cost-effective, boasting a management expense ratio of 0.03%. With VGS providing an extensive investment range of companies, its MER of 0.18% is higher; however, it still presents good value.
To illustrate this in practical terms, for every $1000 invested, VTS will incur a fee of $0.3, while VGS will cost you $1.8. I explored the topic of ETF fees using ASX data in a previous article Who Has The Lowest ETF Management Fees In Australia?, where I focused solely on Australian-domiciled ETFs.
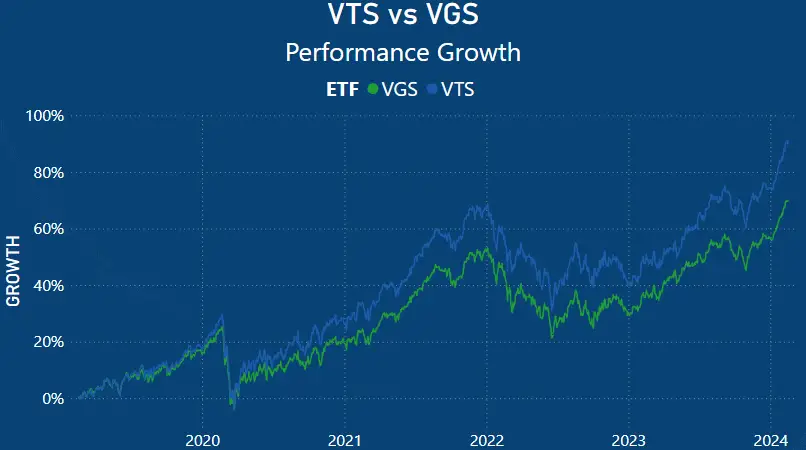
VTS vs VGS Performance Chart
VTS vs VGS Annualised Returns
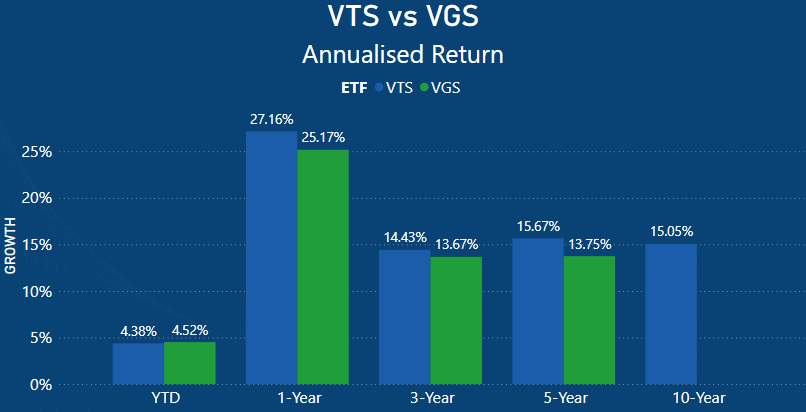
When comparing the average returns of both ETFs, their year-to-date (YTD) performance appears quite similar, as VTS has delivered a 4.38% return, slightly behind VGS’ 4.52%.
Examining the one-year performance, once again VTS emerges as the leader with a 27.16% return, outpacing VGS’ 25.17% one-year annualized return.
Turning to the three-year performance, VTS maintains its lead over VGS with a 14.43% annualized return compared to VGS’ 13.67%. The annualized performance gap between VTS and VGS over the three-year period stands at just 0.76% each year.
Over a five-year period, VTS achieved a 15.67% 5-year annualized return, widening the performance gap to 1.92% over a 5-year annualized period with VGS recording a 13.75% 5-year annualized performance return.
Lastly, while VGS lacks a 10-year record, VTS boasts a 10-year annualized performance return of 15.05%.
To demonstrate VTS’s performance, let’s utilize Morningstar’s 10-year performance growth charts. If you had invested $10,000 into VTS 10 years ago, that investment would now be valued at $40,389 [3].
VTS Top 10 Holdings
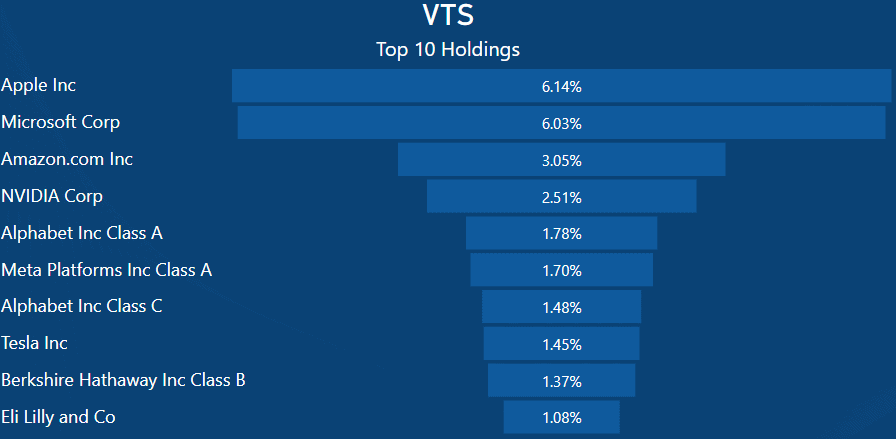
The holdings of VTS include many well-known companies that are household names globally. Among the top 10 holdings are familiar giants like Apple, Microsoft, and Amazon, alongside Meta (formerly Facebook) and Alphabet (Google).
Being a market-weighted cap ETF, VTS allocates its portfolio based on the market capitalization of each stock. This means that companies with larger market capitalizations, such as Apple and Microsoft, would naturally have a significant weight within the overall ETF.
In practical terms, if you were to invest $1000 in VTS, approximately $61.40 would be allocated to Apple shares, $60.30 to Microsoft shares, and $30.50 to Amazon shares.
VGS Top 10 Holdings

The top 10 holdings of VGS closely resemble those of VTS, with slight variations in the weightings of the top 10. VGS shares the same top holdings as VTS, with the only difference being the inclusion of Broadcom instead of Warren Buffett’s Berkshire Hathaway.
Despite VGS tracking a global index excluding Australia, it exhibits a significant weighting towards the US. This bias towards the US market is due to the concentration of many of the world’s largest companies being based in the US and listed on American stock exchanges.
I explored this aspect further in my articles comparing VAS vs VGS: Australia vs The World and examining portfolio diversification through investing in Vanguard’s VGS on the ASX.
IVV vs VTS – Top 10 Holdings As Total Percentage of ETF
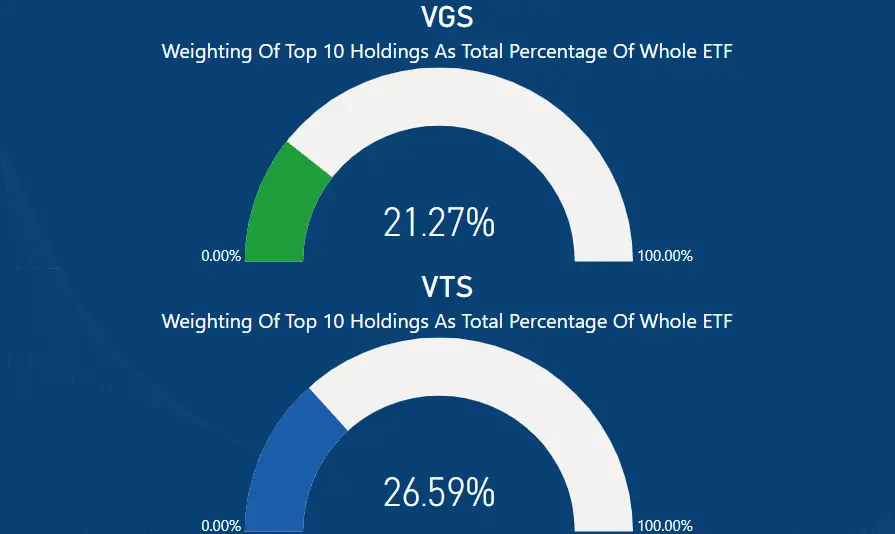
Upon reviewing the top 10 holdings in each ETF, it becomes clear that both VTS and VGS maintain a balanced weighting within their respective top 10 holdings. VGS allocates a combined total of 21.27% to its top 10 holdings, whereas VTS allocates 26.59%.
Despite boasting a substantial number of holdings, VGS with 1429 and VTS with approximately 3743 equity holdings, both ETFs exhibit a considerable allocation towards just 10 companies listed in the US.
VTS vs VGS – Market Cap Percentage
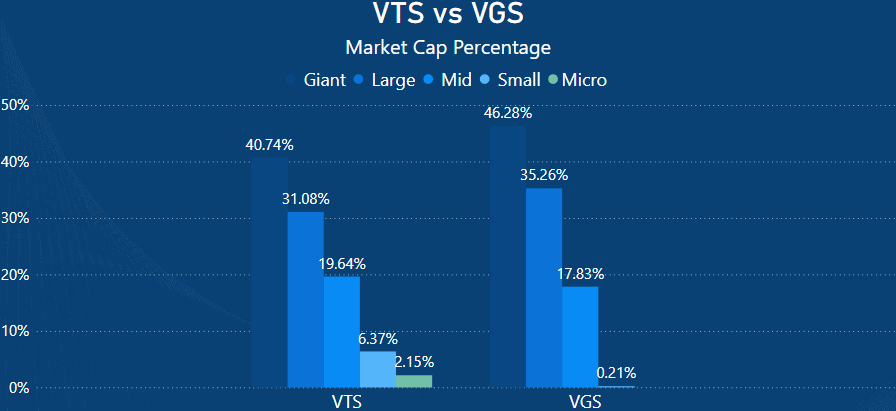
Upon examining the Market Cap percentages, it’s evident that VGS carries the highest weighting towards Giant and large market-cap companies overall.
VGS maintains 46.28% in Giant and 35.26% in large-cap companies, totaling 81.54% of the entire ETF. A smaller portion is allocated to mid-cap companies at 17.83%, with only 0.21% directed towards small-cap.
This distribution aligns with VGS’s global investment strategy, which focuses on leading companies, many of which fall into the giant or large-cap category.
VTS also demonstrates significant weightings towards Giant and large-cap companies, albeit slightly less pronounced. VTS allocates 40.74% to Giant and 31.08% to large-cap companies.
However, differences emerge in the small to micro-cap distribution between VTS and VGS. VTS holds 19.64% in mid-cap, 6.37% in small-cap, and 2.15% in micro-cap. Interestingly, VGS does not include any micro-cap companies in its portfolio.
Summary – Choosing Between Investing in the Entire US Market or a Global Portfolio Including US Companies
When deciding between VTS or VGS, the focus should really be on your underlying goals as an investor. Through investing in VTS, you are essentially backing the US stock market to be the driver of your overall growth.
With over 3700 companies within the ETF, VTS does a great job of capturing the whole US market. But as we have highlighted, your typical top 10 giant US companies still have major sway in how the ETF performs.
VGS, on the other hand, still has quite a weighting in the US and the same top 10 as VTS, but it does capture other parts of the world, which is something I cover in great detail in my VGS Buying portfolio diversification article.
If you’re looking for an ETF that captures much of the developed markets globally, then VGS stands out as a very viable option. It is well priced for what it offers and has performed well throughout its lifetime.
This article does not serve as an endorsement or recommendation for products mentioned in the article. The information presented here is based on referenced sources and is accurate as of the date of February 16, 2024. Please note that these articles are written sometime before their publication date.
The information provided in this content is for informational purposes only and should not be considered as financial, investment, or professional advice. We recommend consulting with a qualified expert or conducting your own research before making any financial decisions.
The accuracy, completeness, or reliability of the information cannot be guaranteed, and the provider shall not be held responsible for any actions taken based on the information contained in this content
- https://www.spglobal.com/spdji/en/indices/equity/sp-500/#overview
- https://www.spglobal.com/spdji/en/indices/equity/sp-asx-200/#overview
- https://www.investsmart.com.au/shares/asx-iwld/ishares-core-msci-world-ex-australia-esg-leaders-etf/fund-details/80168
- https://www.morningstar.com.au/
- https://au.finance.yahoo.com/
- https://www.vanguard.com.au/corporate/
- https://www.vanguard.com.au/personal/invest-with-us/etf?portId=0970
- https://www.vanguard.com.au/personal/invest-with-us/etf?portId=8212