VGS vs QUAL: The Best Diversification ETF vs Quality Index
Last Updated on 4 May 2024 by Ryan Oldnall
Investors seeking to gain exposure to international markets are spoiled for choice in Australia. A number of options exist, from purchasing individual shares to ETFs and mutual funds.
ETFs have become the go-to investment vehicle for many, driven by their low cost, no-hassle, and frankly straightforward approach to getting you into the market. In this article, we will compare two ETFs, VGS and QUAL, which benchmark their performance against the MSCI World ex Australia Index.
Using data from Yahoo Finance and Morningstar, we’ll analyze the performance of these two very different ETFs but ultimately global investment ETFs, comparing costs, performances, holdings and the countries they invest in [1][2].
VGS Review
Pros
Cons
Vanguard, a multinational investment management firm, has had significant influence in the Australian market since its establishment in 1996.
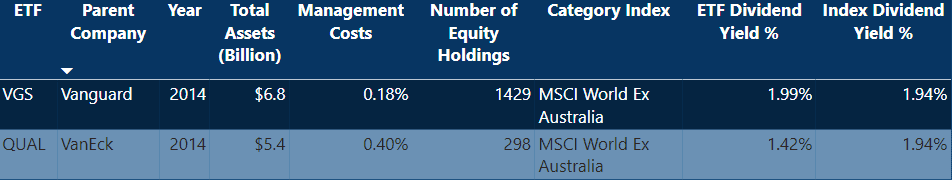
Vanguard, has over 50 million investors globally and manages a total of A$11 trillion in assets, with its Vanguard MSCI Index International Shares ETF (VGS) alone having $6.8 billion invested in it [3][4].
The Vanguard MSCI Index International Shares ETF, known as VGS, made its debut on November 18, 2014. VGS seeks to replicate the performance of the MSCI World ex-Australia index, providing investors with exposure to the largest companies in a number of developed countries.
VGS invests in approximately 1,500 companies from developed countries, excluding Australia. It includes companies from about 23 different countries, such as the US, Japan, UK, Canada, France, and Switzerland [4].
QUAL ETF Review
Pros
Cons
The VanEck MSCI International Quality ETF, more commonly known as QUAL, was introduced on October 29, 2014, under its parent company VanEck. Unlike VGS, which tracks the MSCI World ex-Australia index, QUAL instead tracks the MSCI World ex Australia Quality Index.
Derived from the MSCI World ex Australia Index, a conventional market capitalization-weighted benchmark comprising large- and mid-cap stocks. QUAL’s objective is to track the performance of quality growth stocks chosen from this parent index.
The MSCI World ex Australia Quality Index serves as a refined version of the broader MSCI World ex Australia Index, focusing on quality growth stocks within the index.
MSCI World ex Australia Quality Index achieves this by adjusting the weightings of selected stocks from the parent index, giving more prominence to those with better quality scores. The index’s composition, including represented industries and geographical locations, may shift over time as market dynamics change [5].
VanEck launched its Australian-based business in 2013 and was first established in the US in 1955. Although headquartered in New York, VanEck maintains locations across Europe, Asia, South America, and Australia [5].
In terms of size, VanEck has grown to have $89.5 billion USD, approximately $137.4 billion AUD in assets under management as of December 31, 2023 [6].
Comparatively, Vanguard dwarfs VanEck with $11 trillion AUM globally and $104 billion AUD in assets in Vanguard Australia alone as of August 31, 2022 [7].
VGS vs QUAL Management Expense Ratio (ETF Management Fees)
Management fees, or Management Expense Ratios (MERs), are important when evaluating ETF investments. ETFs aim to track their underlying indices closely, but it’s essential to consider fees and expenses as they can impact returns.
Comparing the management fees of VGS and QUAL , VGS stands out as the more cost-effective option, with a management expense ratio of 0.18%. This represents excellent value considering the broad exposure VGS offers across multiple countries and sectors.
On the other hand, QUAL has a higher management expense ratio of 0.40%, which is over double that of VGS. QUAL with its selective quality criteria for global stocks comes at a premium in this instance.
To put these costs into perspective, for every $10,000 invested, VGS would incur a fee of $18, while QUAL would set you back $40.
I’ve previously explored ETF fees using ASX data in an article titled Who Has The Lowest ETF Management Fees In Australia?, focusing solely on Australian-domiciled ETFs.
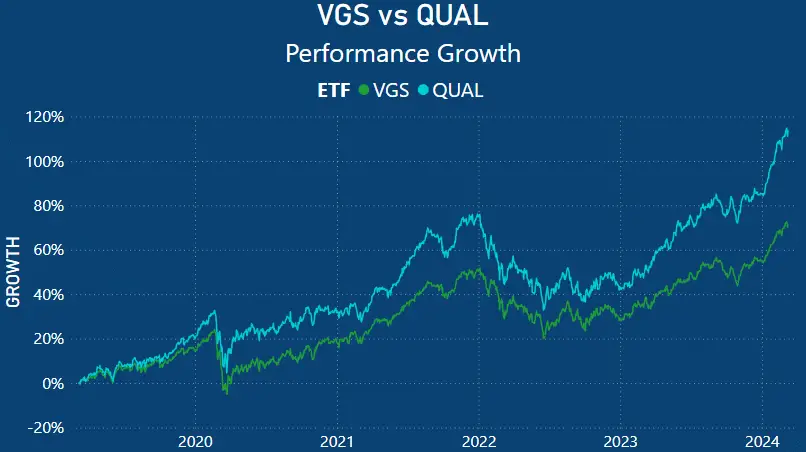
VGS vs QUAL – Performance Chart
VGS vs QUAL – Annualised Returns
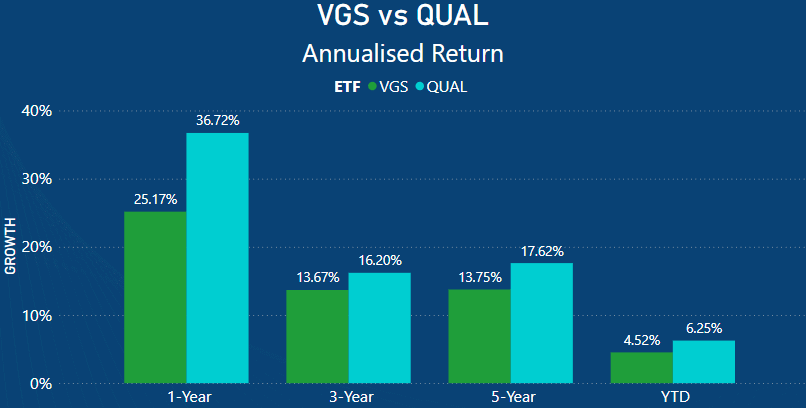
When comparing the side-by-side annualized performances of VGS and QUAL, a clear top performer emerges. The year-to-date (YTD) performances of VGS and QUAL are decent, with QUAL outperforming with a 6.25% return. VGS, on the other hand, has a YTD return of 4.52%, 1.73% less than QUAL.
Annualized returns refer to the average rate of return on an investment over a specific period. It’s a way of representing the compounded return an investment would generate if the same rate of return were achieved every year over the given period.
In this case, these are total annualized returns, meaning any dividends/distributions have been reinvested. The one-year total annualized return of VGS stands at 25.17%, much lower than QUAL’s 36.72%. The performance difference over a one-year period is significant, favoring QUAL by 11.55%.
When extending the analysis to a slightly longer, three-year period, the margin narrows. VGS has a total annualized three-year return of 13.67%, which is 2.53% lower than QUAL’s return of 16.20%.
Looking at the medium term of five years, the performance gap widens. QUAL has seen robust growth at 17.62%. VGS, on the other hand, has achieved a respectable five-year annualized total return of 13.75%, albeit 3.87% lower than that of QUAL.
VGS Top 10 Holdings
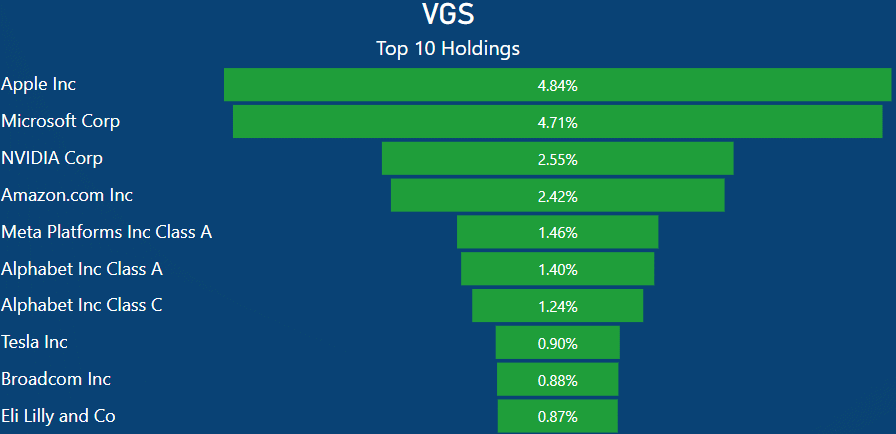
When assessing the top 10 holdings of VGS, several familiar household names emerge. VGS features some of the largest tech companies in its top 10, with significant overall weighting.
Despite being a global ETF with nearly 1500 holdings, VGS exhibits high exposure to the US market, as we will see in greater detail below.
When you invest $1000 in VGS, you effectively purchase $48.40 worth of Apple shares, $4.71 in Microsoft, and $25.50 in Nvidia, among others.
QUAL Top 10 Holdings
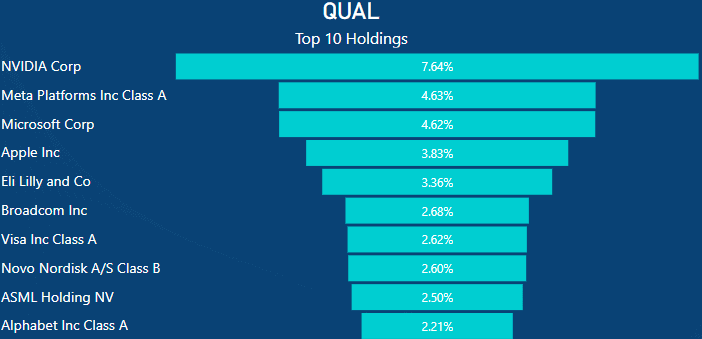
The top 10 holdings of QUAL differ somewhat from those of VGS, despite both tracking the same MSCI World ex Australia Index as a benchmark. However, the underlying index deviates due to the ‘Quality’ mandate of the QUAL ETF.
QUAL includes some familiar names in its top 10 holdings, such as Nvidia at 7.64%, Meta at 4.63%, Microsoft at 4.62%, and Apple at 3.83%.
These names are also present in VGS‘ top 10 holdings, albeit with different weightings. Among the top 10 holdings, ASML Holding NV, Visa, and Novo Nordisk are included in QUAL at the expense of Tesla, Alphabet C class, and Amazon in VGS.
If you were to invest $1,000 in QUAL, your investment would translate to approximately $76.40 worth of Nvidia shares, $46.30 of Meta, and $38.30 of Apple, among other holdings.
VGS vs QUAL Top 10 Holdings As A Total Percentage Of ETF
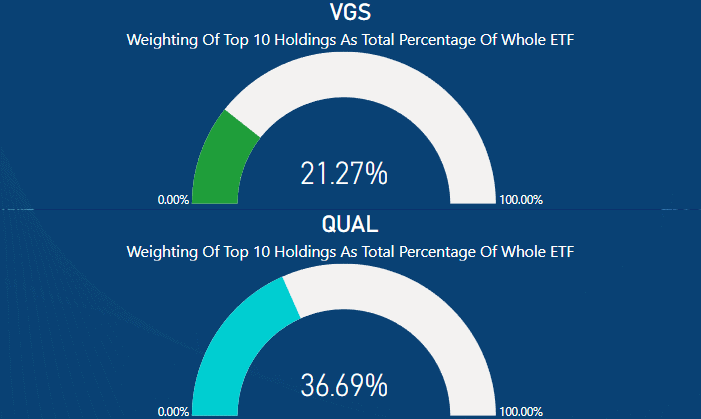
When comparing VGS and QUAL‘s top 10 holdings as a total percentage of the whole ETF, QUAL has the higher overall weighting. QUAL‘s top 10 holdings make up 36.69% of the total ETF, compared to VGS at 21.27%.
In terms of total equity holdings overall, QUAL has 298 holdings compared to VGS‘s 1429. VGS is widely regarded as a highly diversified ETF due to its extensive holdings. However, QUAL also demonstrates considerable diversification with nearly 300 holdings.
VGS vs QUAL Continent Weighting
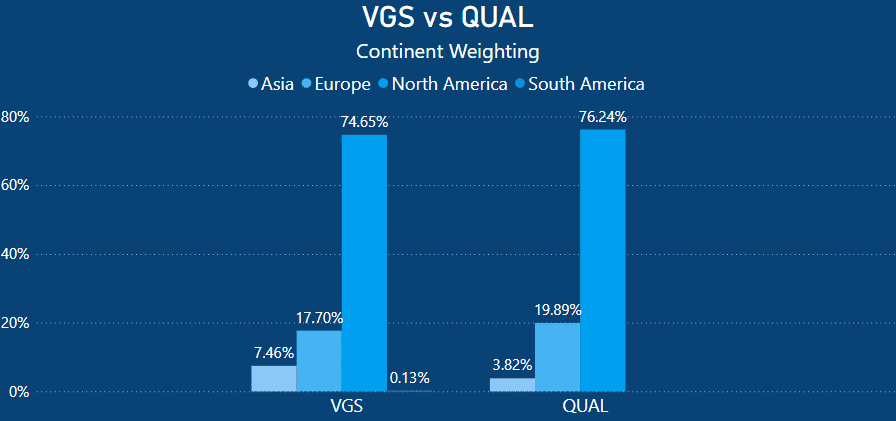
When considering the continental breakdown, both VGS and QUAL exhibit significant weightings in North America, with VGS at 74.65% and QUAL slightly higher at 76.24%.
In contrast, VGS has a 7.46% exposure to Asia, while QUAL holds a lower proportion at 3.82%. Both ETFs show decent representation in Europe, with VGS at 17.70% and QUAL slightly higher at 19.89%.
VGS allocates a modest portion, just 0.13%, to South America, while QUAL does not hold any investments within this region.
VGS vs QUAL Country Weighting
When we break down the actual country allocations, as expected, both VGS and QUAL are heavily weighted in the US [2]
- United States:
- VGS: 72.21%
- QUAL: 75.43%
- Both VGS and QUAL have a significant allocation to the United States, reflecting their overall high exposure to US equities.
- Japan:
- VGS: 6.32%
- QUAL: 3.45%
- VGS has a higher allocation to Japan compared to QUAL, with VGS having a 2.87% allocation in the Asian country.
- United Kingdom:
- VGS: 3.73%
- QUAL: 3.86%
- Both VGS and QUAL have a notable but relatively similar allocation to the United Kingdom.
- Canada:
- VGS: 3.02%
- QUAL: 1.17%
- VGS has a higher allocation to Canada compared to QUAL.
- Switzerland:
- VGS: 2.93%
- QUAL: 5.13%
- QUAL has a higher allocation to Switzerland compared to VGS
- France, Germany, Netherlands, Denmark, Sweden, and Italy:
- QUAL has allocations to France, Netherlands, Denmark, and Sweden, while VGS does not have significant allocations to these countries.
Both VGS and QUAL have significant allocations to the United States, but they differ in their exposure to other countries.
VGS offers diversified international exposure, including holdings in Japan, Canada, and the UK, among others. In contrast, QUAL is more heavily focused on U.S. equities and has a higher concentration in other European nations.
VGS vs QUAL Market Cap
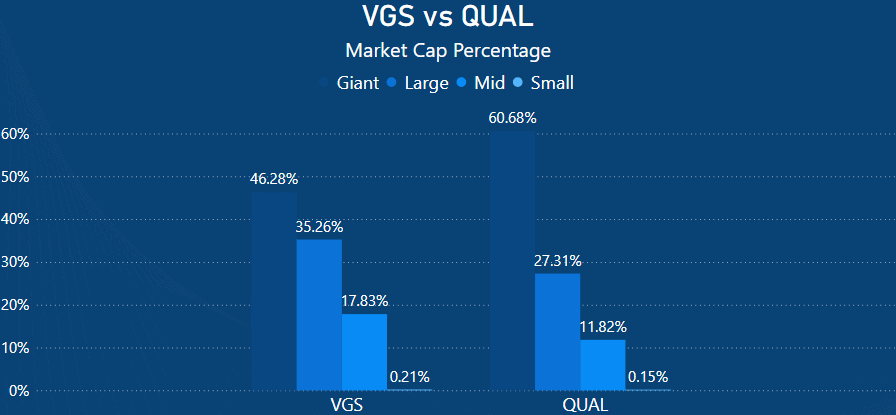
When assessing the market cap weighting of VGS and QUAL, it’s expected that QUAL would have a higher proportion of giant-cap companies, according to Morningstar’s cap classification.
QUAL, following a modified MSCI World ex Australia Index that selects high-quality global companies from the developed world, tends to favor larger companies. Consequently, it comprises of 60.68% giant-cap companies, whereas VGS is slightly lower at 46.28%.
In terms of large-cap companies, VGS holds a higher proportion at 35.26% compared to QUAL’s 27.31%.
However, when examining mid-cap and small-cap makeup, VGS is also higher. VGS has 17.83% in large caps and 0.21% in mid-caps, while QUAL sits at 11.82% and 0.15%, respectively.
This indicates that QUAL has a significant weighting towards giant-cap companies, while VGS is also weighted towards both giant and large-cap companies to a greater extent.
Summary – Quality Index vs World Index
When comparing these ETFs side by side, they each have distinct characteristics despite both tracking the same international benchmark but following different indexes.
VGS has a high level of diversification, largely attributed to its extensive holdings, spanning various sectors, countries, and continents. QUAL also has great global diversification with a respectable number of holdings, around the 300 mark.
However, the notable difference lies in QUAL’s application of quality scoring criteria in stock selection. Consequently, the composition of QUAL may evolve over time as companies are included or excluded based on this criteria.
Both VGS and QUAL have delivered impressive total annualized returns, making them preferred global choices for many investors. The decision between VGS and QUAL would likely be influenced by the other holdings in your portfolio.
Despite both offering substantial global diversity, it’s worth noting that VGS has a 72.21% weighting in America, while QUAL has a slightly higher weighting at 75.43%. If you seek more exposure to Asia, VGS might be the preferable option over QUAL.
This article does not serve as an endorsement or recommendation for products mentioned in the article. The information presented here is based on referenced sources and is accurate as of the date of 09 March 2024. Please note that these articles are written sometime before their publication date.
The information provided in this content is for informational purposes only and should not be considered as financial, investment, or professional advice. We recommend consulting with a qualified expert or conducting your own research before making any financial decisions.
The accuracy, completeness, or reliability of the information cannot be guaranteed, and the provider shall not be held responsible for any actions taken based on the information contained in this content.
References
- https://au.finance.yahoo.com/
- https://www.morningstar.com.au
- https://www.vanguard.com.au/corporate/
- https://www.vanguard.com.au/personal/invest-with-us/etf?portId=8212
- https://www.vaneck.com.au/etf/equity/qual/snapshot/
- https://www.vaneck.com/us/en/our-firm/about-us/
- https://www.vanguard.com.au/super/about-us
- IVV vs VGS: Which ETF Delivers Better Returns?Considering Investments in VGS and IVV? Explore Their Key Similarities and Differences. Discover Why VGS Offers Greater Diversification.
- NVIDIA’s Market Value Plummets: $418 Billion Lost Since July Peak Amid 9.76% Weekly Share Price DropIn a stunning reversal of fortune, Nvidia’s stock (NVDA) has experienced a significant decline in recent weeks. The company’s share…
- Is CrowdStrike Stock a Good Buy Following the Recent Outage?Last Updated on 21 July 2024 by Ryan Oldnall CrowdStrike Global Outage: What Happened? On Friday, July 19, a seemingly…
- VGS vs QUAL: The Best Diversification ETF vs Quality IndexLast Updated on 4 May 2024 by Ryan Oldnall Investors seeking to gain exposure to international markets are spoiled for…
- NDQ vs FANG: Which Tech ETF Is Right For You?Last Updated on 30 March 2024 by Ryan Oldnall In 2023, American Tech companies, particularly those investing in artificial intelligence,…