SYI ETF Review: Maximizing Income with High Dividend Yields
Last Updated on 20 February 2024 by Ryan Oldnall
If you’re an investor seeking to boost your income through an ETF that generates returns, SYI could be a suitable choice. With its high dividend yield, SYI can serve as an income-generating component in any portfolio.
In this SYI ETF Review, we will evaluate its 5-year performance history, its average performance over time, and its top holdings.
What Is The SYI ETF?
The SPDR MSCI Australia Select High Dividend Yield Fund (ASX: SYI) is structured to mirror the performance of publicly traded Australian companies that offer an above-average dividend yield and the potential for franked dividend income.
SYI ETF Chart & SYI Share Price

When examining SYI’s performance growth over a 5-year period, it has experienced a somewhat volatile journey over time. Much like many ETFs tracking the S&P/ASX 200, it follows a similar rollercoaster trajectory.
In 2019, SYI saw an increase from approximately $24.92 per ETF to $30.78. However, during the COVID-19 pandemic, similar to most Australian shares and US stocks, it experienced a sharp decline as the world grappled with widespread border closures.
Nevertheless, in the middle of 2020, it staged a significant rally, which extended into 2021 and partway into 2022, but the ETF’s price started to decline thereafter. As of 2023, the ETF price has exhibited relatively stagnant growth.
SYI Share Performance
When you analyze the SYI Growth Chart above and compare it to the annualized performances, at first glance, you might notice a discrepancy.
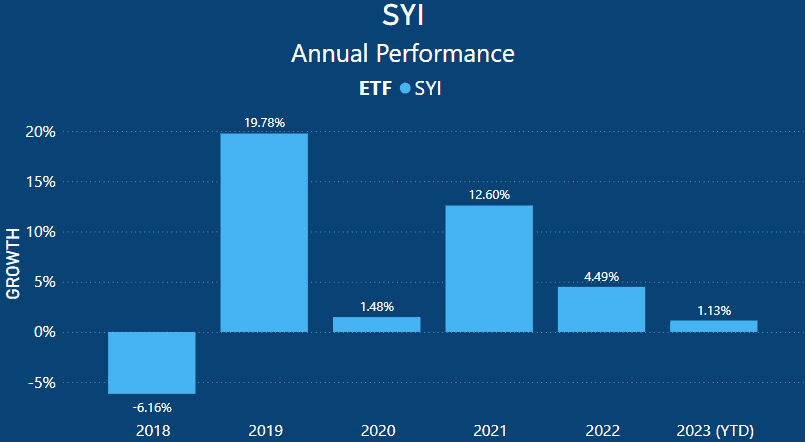
In the growth chart I described, you can visually see the growth in 2019. However, those with a more astute grasp of mathematics would recognize that the visual ETF share growth doesn’t align with a 19.78% increase.
This discrepancy arises because SYI is a high dividend-yielding ETF. The annual performances are calculated based on what’s known as “Total Return.” In the case of total return, it encompasses both capital gains (ETF price growth) and dividends.
In the case of SYI, we can observe that it grew very little overall in 2020 and had a solid year in 2021, with a 12.60% total return. However, as we noted on the growth chart, the performance from 2022 to year-to-date has been somewhat lackluster.
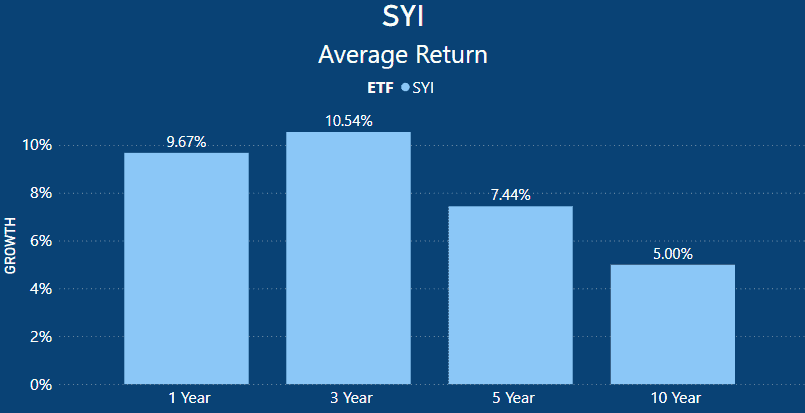
When examining the average returns of SYI over various time spans, the results appear satisfactory in the short to medium term. SYI currently boasts an average 1-year return of 9.67% and a commendable 3-year return of 10.54%.
Furthermore, the 5-year return of 7.44% is respectable, while the 10-year return of 5% is not as impressive. To provide context, the Australian share market, as represented by the S&P/ASX 200, yielded a 1-year total return average of 6.04% and a 3-year average performance of 9.09% [1].
Over the medium to long-term time frame of 5 to 10 years, the ASX 200 returned 7.73% and 6.93%, respectively [1]. This indicates that SYI outperformed the broader ASX 200 in its 1-3 year averages but underperformed over the longer term.
It is crucial to note that SYI is not a growth-centric ETF; its primary focus is income generation. This sets it apart from ETFs like A200 and VAS, which are growth-focused and receive dividends as an additional benefit.
SYI Dividend
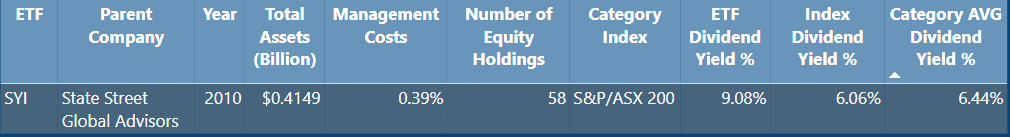
When investing in SYI, your primary focus is on its dividend or distribution potential. SYI offers a dividend yield of 9.08%, which is notably 3.02% higher than the index yield of 6.06% and surpasses the category average of 6.44%.
SYI distributes its dividend on a quarterly basis, with the most recent payment made on 13/10/2023, totaling approximately $0.50 per ETF.
SYI Top 10 Holdings
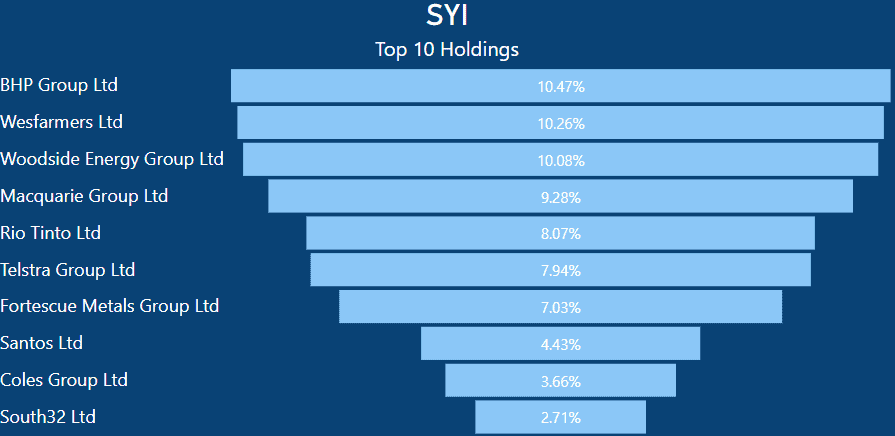
The top 10 holdings of SYI closely resemble those of other high dividend-yielding ETFs. The fund places a priority on companies that are renowned for distributing a portion of their profits as dividends, and in some cases, providing franking credits.
Notably, there is a significant weighting in companies such as BHP, Wesfarmers, Woodside Energy, Macquarie, and Rio Tinto, all of which are recognized for their franking credits and dividend payouts.
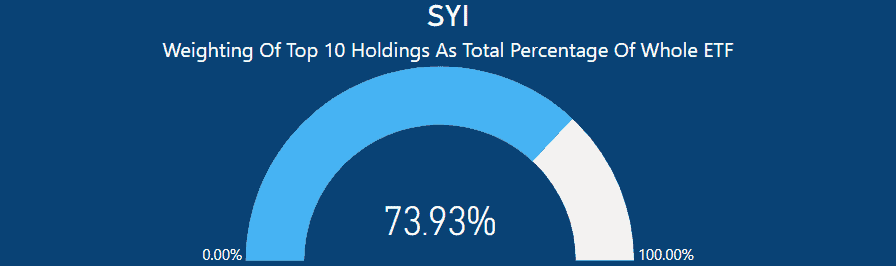
Interestingly, when you express the top 10 holdings as a total percentage of the entire ETF, they constitute a surprisingly substantial portion. These top 10 holdings account for 73.93% of the entire ETF.
Within the ETF, there are a total of 58 equity holdings, with less than 5% allocated to other investments. This implies that a significant part of the ETF’s overall performance is heavily reliant on just a handful of companies.
Notably, six of the top 10 holdings are in the mining and oil and gas sectors. These companies are often influenced on a global scale by the demand for their products. Consequently, in periods of reduced demand, their performances may suffer as a result.
Summary – Is SYI A Good Investment?
SYI could be a suitable investment for those seeking an income-generating ETF. This high dividend-yielding ETF is well-suited for individuals who are not primarily looking for long-term growth, as is often the case with ETFs like VAS, A200, IOZ, and similar options.
However, there is a note of caution, primarily concerning the heavy weighting of the top 10 companies in influencing the overall performance of the ETF.
With just 10 companies making up nearly three-quarters of the entire ETF, and six of those belonging to the mining and oil and gas sectors, you are heavily exposed to one sector’s performance.
The high yield of SYI is a result of selective stock picking and stands well above the index. For those interested in both income and growth prospects, it might be worth considering options like DHHF vs VDHG, for a more balanced approach.
This article does not serve as an endorsement or recommendation for products mentioned in the article. The information presented here is based on referenced sources and is accurate as of the date of November 5, 2023. Please note that these articles can be written sometime before their publication date.
The information provided in this content is for informational purposes only and should not be considered as financial, investment, or professional advice. We recommend consulting with a qualified expert or conducting your own research before making any financial decisions.
The accuracy, completeness, or reliability of the information cannot be guaranteed, and the provider shall not be held responsible for any actions taken based on the information contained in this content.