
VOO Vs SPY: Simple Guide For Everyday Investors
Last Updated on 20 February 2024 by Ryan Oldnall
Over the past decade, the US stock market has seen some incredible growth, even in the face of challenges like the Covid-19 pandemic. Despite taking a big hit in early 2020, the 10 year annualized total return, as of today, sits at 12.82% [1].
In this article, we will compare the performance of two heavyweights in the ETF market: VOO vs SPY.
Our analysis will give you a good, solid look at both of these ETFs, helping you figure out which one lines up better with your investment goals.
Vanguard VOO Review
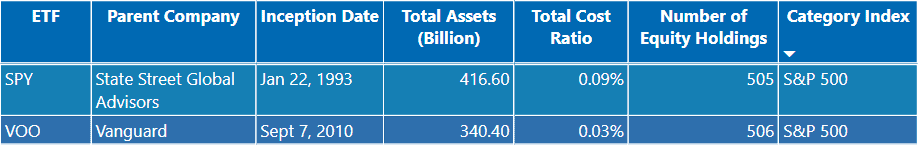
VOO is the ticker symbol for the Vanguard S&P 500 ETF. It is an exchange-traded fund (ETF) offered by Vanguard Group, one of the world’s largest investment management companies.
Founded in 1975, Vanguard has since become a widely recognized and trusted name in the financial industry. With a global investor base exceeding 50 million individuals and an impressive $7.2 trillion in assets under management (AUM) [2],[3], Vanguard has solidified its prominent position in the world of investment management.
VOO is designed to track the performance of the S&P 500 Index, which is a widely followed benchmark of the U.S. stock market.
Investing in VOO allows individuals to gain exposure to a broad range of large-cap U.S. stocks, as the ETF holds the same stocks in roughly the same proportions as the S&P 500 Index.
This provides investors with a convenient way to diversify their portfolio across many of the largest and most well-known companies in the United States.
Since VOO aims to replicate the performance of the S&P 500 Index, its returns are generally similar to the overall performance of the U.S. stock market.
Many investors use VOO as a core holding in their investment portfolios due to its low expense ratio and broad market exposure.
SPY Review
The SPDR S&P 500 ETF Trust, known by its ticker symbol SPY, is a prominent investment vehicle that allows investors to mirror the performance of the S&P 500 Index.
Launched in January 1993, SPY holds the distinction of being one of the pioneering ETFs, marking a significant development in the world of investment.
Managed by State Street Global Advisors (SSGA), a division of State Street Corporation, SPY has played a pivotal role in broadening access to the most significant and influential companies within the U.S. stock market.
Since its inception, SPY has steadily gained popularity among both individual and institutional investors due to its simplicity and efficiency.
By investing in SPY, individuals can gain exposure to a diversified portfolio consisting of the 500 largest publicly traded companies in the United States.
ETF Expense Ratio
The ETF expense ratio relates to the annual costs associated with investing in an ETF, covering responsibilities such as management and promotion of the ETF.
These expenses typically constitute a small portion of your investment but can influence your overall returns. It’s important to explore ETFs with lower fees, as this allows you to retain a larger share of your profits.
Currently, the VOO ETF boasts an expense ratio of only 0.03%. This means that a $10,000 investment in VOO incurs just $3 in fees.
In a similar vein, the SPY ETF has a slightly higher expense ratio but still offers a competitive total cost ratio of 0.09%. For a $10,000 investment in SPY, this translates to $9 in fees.
VOO vs SPY – 5 Year Performance Comparison
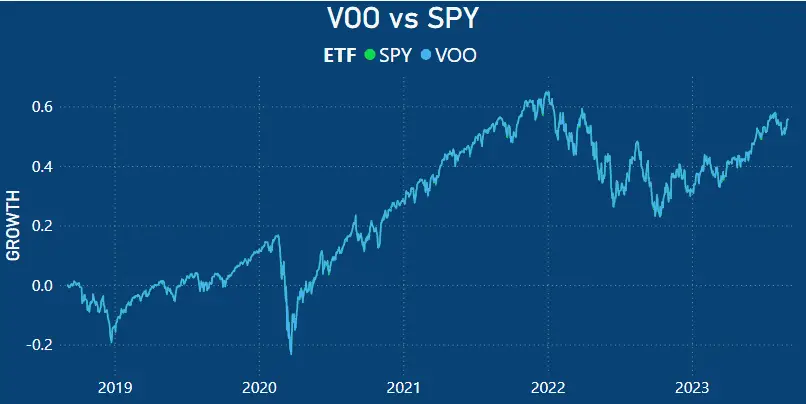
When assessing the performance of SPY and VOO over the past five years, it becomes quite challenging to discern any substantial differences between the two.
Over this half-decade timeframe, both SPY and VOO have exhibited remarkably similar performance, to the extent that it is difficult to visually pinpoint any notable distinctions in their respective performances.
During this period, the performances of both SPY and VOO have closely paralleled one another.
This means that investors who have tracked these ETFs over the last five years have seen comparable returns, making it difficult to discern a clear advantage in terms of performance between the two.
VOO vs SPY – Annual Performance Comparison
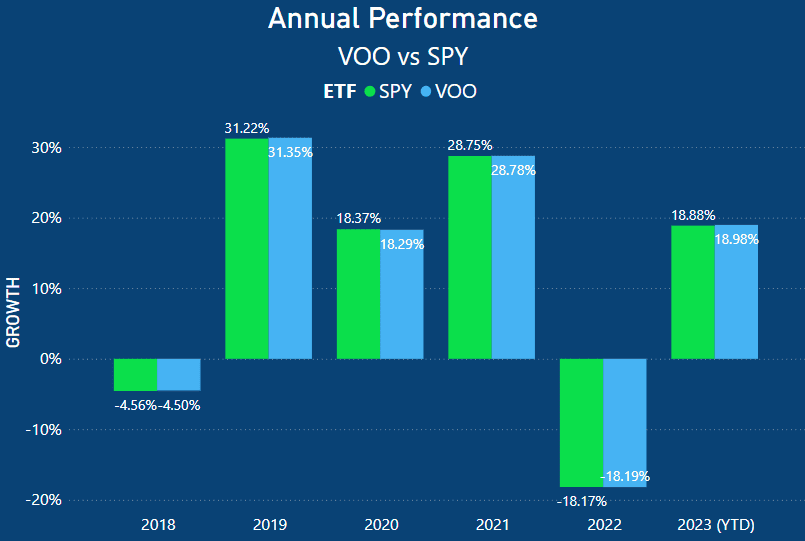
When we analyze the annual performance of these two ETFs in comparison, it becomes clear that the differences in their performance have consistently been relatively small. The most significant deviation occurred in 2019 when VOO outperformed SPY by a margin of 0.13%.
As of 2023 year-to-date, we once again see a slight advantage for VOO, this time by 0.10%. However, it’s worth noting that this difference remains quite marginal.
Overall, the performance distinctions between VOO and SPY have generally been minimal, featuring occasional subtle variations that may not have a significant impact on investment decisions.
S&P 500 and ETF Holdings
The S&P 500 is a stock market index comprising 500 of the largest publicly traded companies listed on U.S. stock exchanges.
These companies represent a wide array of industries and sectors, providing a diverse and comprehensive overview of the U.S. stock market.
The index is unique in that it employs a market capitalization-weighted methodology, where companies with larger market capitalizations exert a more substantial influence on the index’s performance.
This approach acknowledges the significant role that larger companies play in the U.S. economy, making the S&P 500 a vital benchmark and indicator of the health and trends of the broader market.
Consequently, this directly influences the composition of ETFs designed to mirror the market.
VOO Holdings
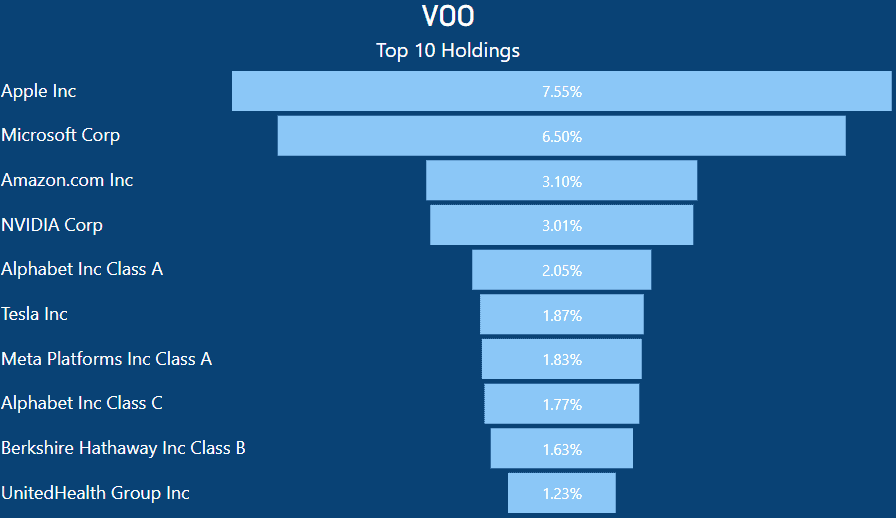
VOO holds substantial investments in a few key U.S. companies, with the largest stake being in Apple.
By dedicating 7.55% of its portfolio to Apple, if you had $1,000 invested in VOO, $75.50 of that would be in Apple stock.
Given the substantial market capitalization of U.S. tech stocks, it’s not surprising that they play a prominent role in VOO’s ETF.
Interestingly, among the top 10 holdings, only Warren Buffett’s Berkshire Hathaway and UnitedHealth Group don’t have a technology or artificial intelligence focus.
SPY Holdings
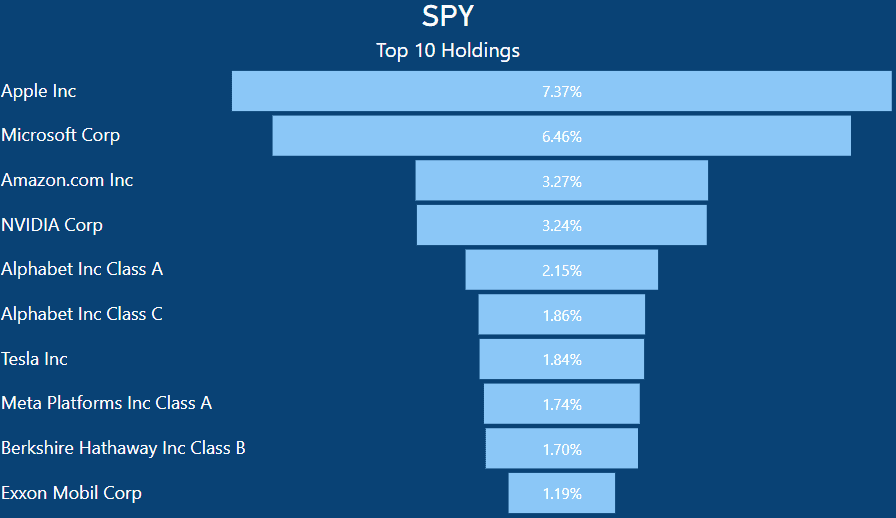
Similar to VOO, SPY also holds a significant position in Apple. If you invest $1,000 in SPY, you would own approximately $73.70 worth of Apple stocks.
Apple holds a substantial weight in the ETF, consistently breaking records by becoming the first publicly traded company to reach a $3 trillion market value.
Both SPY and VOO stock include many of the same technology-related stocks. As previously mentioned, U.S. tech companies have substantial market capitalization, making them a large portion of these ETFs.
The primary difference in their holdings lies in the presence of Exxon Mobil within SPY’s top 10 holdings, whereas VOO stock includes UnitedHealth Group in its top holdings.
SPY vs VOO – Top 10 Holdings As Total Percentage of ETF
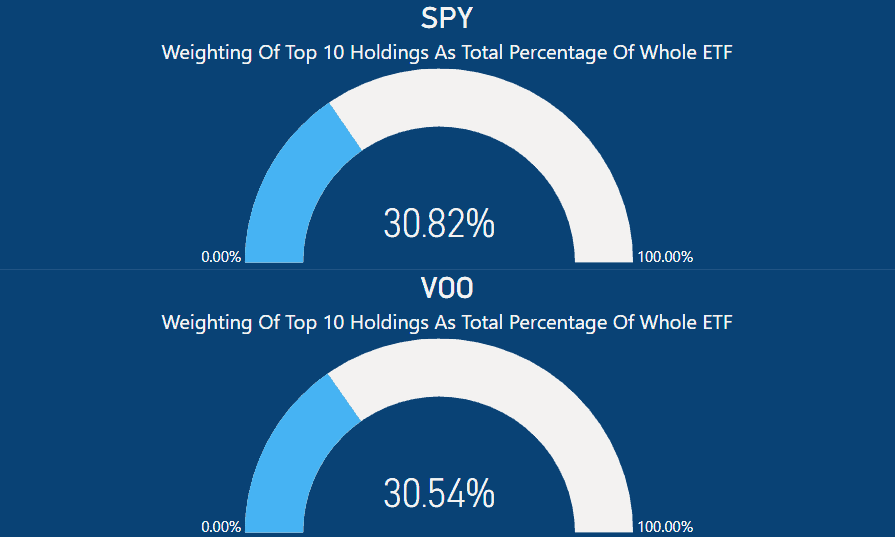
When we take a close look at the top 10 holdings and their respective weightings within the ETFs, it’s clear that they make up a significant portion.
In the case of the SPY ETF, these 10 holdings collectively represent a substantial 30.82% of the entire ETF.
As mentioned earlier, the SPY ETF maintains precisely 505 equity holdings, leaving the remaining 495 equities to account for the remaining 69.18%.
Likewise, within the VOO ETF, the top 10 holdings contribute to 30.54% of the ETF’s composition. This means that the remaining 490+ stocks would make up the remaining 69.46%.
Moreover, since both ETFs have nearly identical top 10 holdings and very similar weightings, their overall performances closely mirror each other.
This explains the minimal performance variations observed between them, highlighting why SPY and VOO stock prices tend to follow similar patterns.
VOO vs SPY – Market Cap Percentage
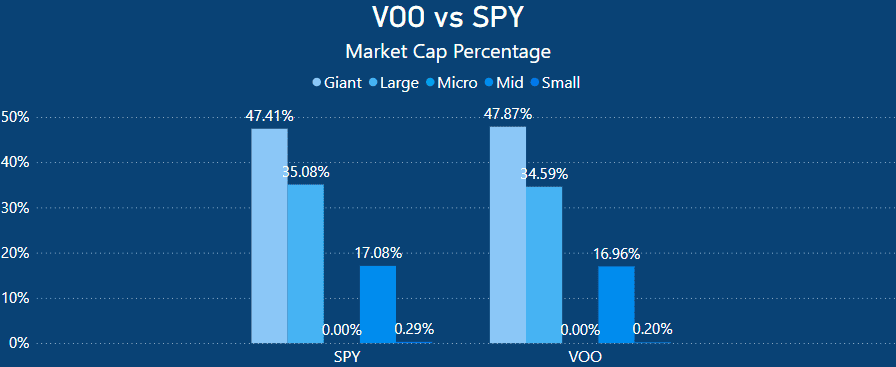
Upon analyzing the holdings of both VOO and SPY, it becomes evident that both allocate substantial portions to large-cap and giant corporations.
When we sum up the market capitalization of these substantial and sizable corporations, VOO comprises 82.46%, while SPY encompasses 82.49% within their respective investment portfolios.
As a result, a considerable portion of both ETFs is allocated to well-established corporate giants recognized for their stability.
Therefore, it’s highly improbable that either ETF would have significant holdings in emerging companies such as Tesla, Apple, or Google, as these iconic firms originated as small enterprises and expanded gradually.
Within the framework of these ETFs, such companies would only constitute a minor portion of the overall investment until they attain a significant market presence and attract substantial investments
For instance, SPY allocates 0.29% to smaller companies, while VOO has a similar allocation at 0.20%.
VOO vs SPY – Asset Class Allocation
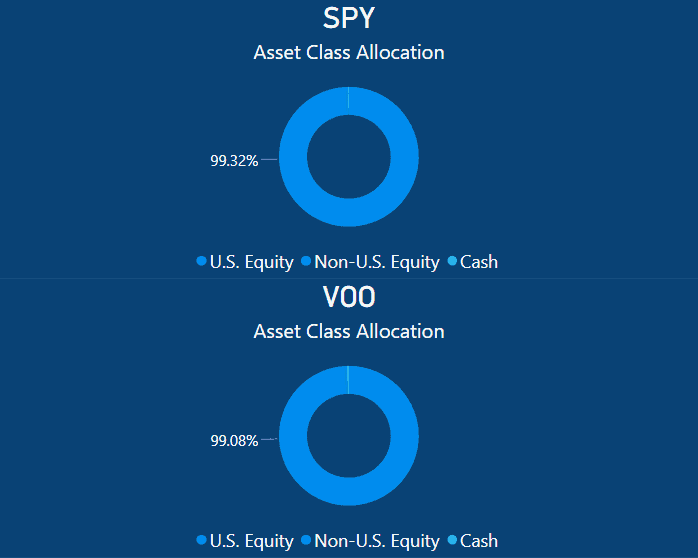
Regarding asset allocation, VOO directs 99.08% of its portfolio toward U.S. equities, while the remaining 0.92% is distributed among non-U.S. equities and cash holdings.
Similarly, SPY allocates 99.32% of its assets to U.S. equities, with the remaining 0.68% divided between non-U.S. equities and cash.
Summary – Investor’s Dilemma: VOO vs. SPY
When deciding between VOO stock and SPY stock, both ETFs offer an appealing value proposition due to their low management fees, providing investors with an opportunity to access a broad-based index at low cost
For the average investor, obtaining access to up to 500 individual stocks would usually incur significant brokerage fees, which could be prohibitively expensive.
Therefore both ETFs provide excellent diversification which would otherwise be difficult to achieve.
However, it’s important to acknowledge that both ETFs have substantial weightings in some of America’s largest companies. Which can skew overall performance and be a source of future uncertainty.
For instance, companies like Tesla have exhibited significant volatility in recent years, surging during the COVID-19 pandemic and subsequently experiencing sharp declines in 2022. They alone account for 1.83-1.87% of each ETF.
Counter to that, companies like NVIDIA have seen meteoric growth, with a year-to-date return of 233.91%. Along with other technology stocks, they significantly influenced the overall performance of the S&P 500.
With both ETFs being very similar in their composition it is practical to invest in both SPY and VOO simultaneously, as they share nearly identical holdings in many respects.
Ultimately, the key consideration for me comes down to the expense ratio.
VOO offers a lower expense ratio of 0.03% compared to SPY’s 0.09%. While there is often discussion about the liquidity of the stocks and narrower bid-ask spreads for SPY due to higher trading volumes, both ETFs are highly liquid, given their substantial trading activity.
Furthermore, for the average investor, the intention is often to hold these ETFs for the long term rather than engage in day trading.
Therefore, the expense ratio remains a deciding factor for me when choosing between the two.