
VDHG vs VAS: A Deep Dive
Last Updated on 20 February 2024 by Ryan Oldnall
Investors have a multitude of choices when considering ETFs, often leading to analysis paralysis. Such options include Vanguard Diversified High Growth Index ETF (VDHG) and VAS, Vanguard Australian Shares Index ETF, which tracks the S&P/ASX 300 Index.
In Australia, investors are also familiar with other ETFs offering complexity and diversity. One such example is VDHG, a large ETF that includes holdings in both VAS and other index funds.
In this article, we’ll explore VDHG, an all-in-one ETF, and compare it to Australia’s popular VAS. We’ll highlight both similarities and differences, providing insights to help you make informed choices that suit your needs.
Vanguard VAS Review and VDHG Review
Vanguard, a globally renowned investment management firm with a strong track record, has been a prominent player in the Australian market since 1996.
In 2009, they introduced VAS, Australia’s most popular ETF, which closely tracks the S&P/ASX 300, the top 300 ASX-listed companies. [1] A single VAS ETF unit is domiciled in Australia and currently costs $85.33.
The Vanguard Diversified High Growth Index ETF (VDHG) is Vanguard’s Australian High Growth Index ETF, was introduced in 2017.
VDHG invests approximately 90% in growth assets and 10% in fixed income, including Australian fixed interests and international bonds [2]. This ETF invests in over 16,000 securities and, like VAS, is domiciled in Australia.
Vanguard serves over 50 million investors worldwide, with VAS alone having $12.7 billion in assets under management [3] and VDHG manages 2 billion in assets under management, and Vanguard oversees a significant total of over A$10 trillion in assets worldwide [2],[3].
ETF Management Fees
ETF management fees cover the annual costs associated with overseeing and promoting investments in ETFs. Typically, these fees make up a small portion of your investment, impacting your overall returns.
Choosing ETFs with lower fees is recommended, as it ensures that a larger portion of your earnings stays in your pocket.
ETFs are well-known for their cost-effectiveness when compared to other investment options. To better understand the fee structure, it’s essential to review an ETF’s Product Disclosure Statement (PDS).
VAS and IOZ stand out by offering some of the most competitive fees in the Australian ETF market, even when compared to competitors like BetaShares A200.
VAS recently lowered its management fee from 0.10% to 0.07%, starting on July 3, 2023. This means that for a $10,000 investment in VAS ETFs, you would pay $7 in fees.
On the other hand, VDHG has a higher ETF management fee at 0.27%, resulting in $27 in fees on a $10,000 investment.
VAS Dividend History
If you’re an Australian investor, you’re probably searching for an ETF that offers dividends, and VAS certainly fulfills this criteria.
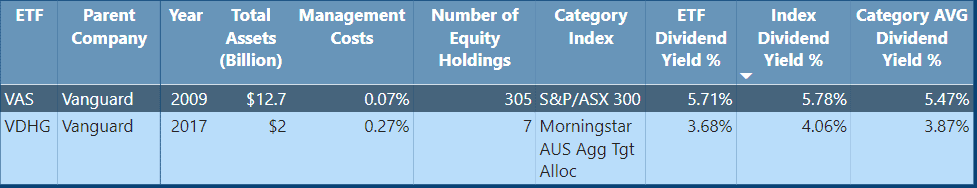
VAS boasts a noteworthy dividend track record, offering a yield of 5.71%. This yield compares favorably to the index average of 5.78% and the category average of 5.47%.
One of the benefits of VAS is its quarterly dividend distribution, ensuring investors receive a steady income stream. Additionally, its Australian domicile brings the added advantage of simplified paperwork and more convenient management.
VDHG Dividend History
Like other Australian ETFs, VDHG also offers a dividend, but its yield stands at 3.68%, notably lower than VAS. This contrast is mainly due to the composition of the ETF, which differs significantly from VAS.
VAS derives its dividends/ distributions from Australian companies, a common practice in the Australian market. However, VDHG’s diversified holdings across the globe mean that dividends are less prevalent in other parts of the world.
VDHG vs VAS – Performance Growth Chart
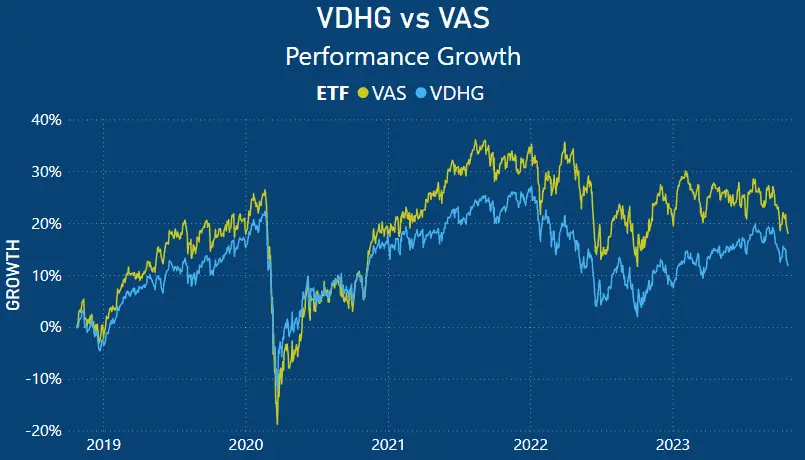
When we compare the performance of VAS and VDHG over time, we can observe that VAS has shown significantly stronger relative growth. Starting from late 2018 and onwards, VAS has consistently delivered superior performance.
In 2020, both ETFs experienced substantial declines in their prices, with VAS being the most affected. VDHG, being diversified across multiple markets, while VAS is exclusively tied to the ASX 300, displayed varying results.
The growth witnessed in 2021 has started to slow down, and 2023 is proving to be a challenging year for both the ASX 300 and the global economy.
VAS vs VDHG – 5 Year Annual Performance Comparison
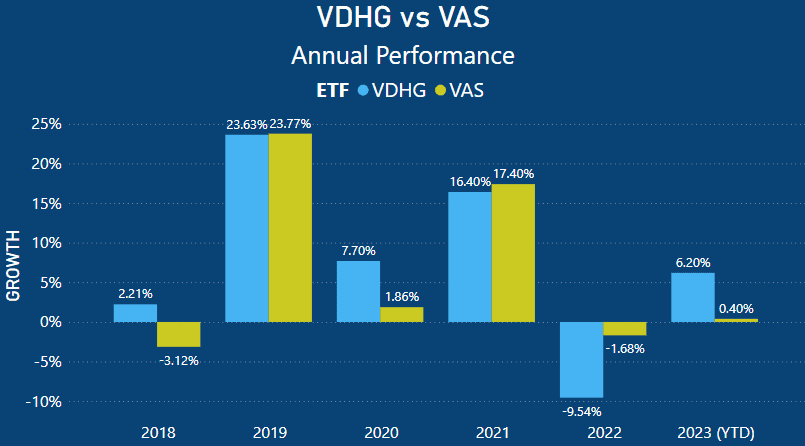
When examining the individual annualized returns, it becomes much easier to identify the better-performing ETF in each respective year.
In 2018, VDHG significantly outperformed VAS, with VDHG gaining 2.21% and VAS experiencing a loss of -3.12%, resulting in a performance difference of 5.33%.
In 2019, both ETFs exhibited strong performances, with VDHG returning 23.68% and VAS returning 23.77%. As the global economy faced challenges due to the onset of Covid-19, both took a hit in performance. VAS returned a modest 1.86%, while VDHG delivered a respectable 7.70%.
The global diversification of VDHG played a key role in its out-performance by 5.84% in 2020.
In 2021, both VAS and VDHG saw robust rallies once again. This time, VAS took the lead with a 17.40% performance, surpassing VDHG by 1%, which achieved a 16.40% return in 2021.
In 2022, both ETFs faced significant losses, with VDHG experiencing a more substantial decline. VDHG recorded a loss of -9.54%, while VAS lost -1.68%. These declines were influenced by concerns about a global recession, increasing inflation worldwide, and the Russian invasion of Ukraine.
As of 2023 year-to-date (YTD), VDHG has outperformed VAS. VDHG has achieved a return of 6.20%, whereas VAS has struggled with a 0.40%. The strong opening highs seen in January and February have eroded considerably.
VDHG vs VAS Average 3 Year, 5 Year and 10 Year Return
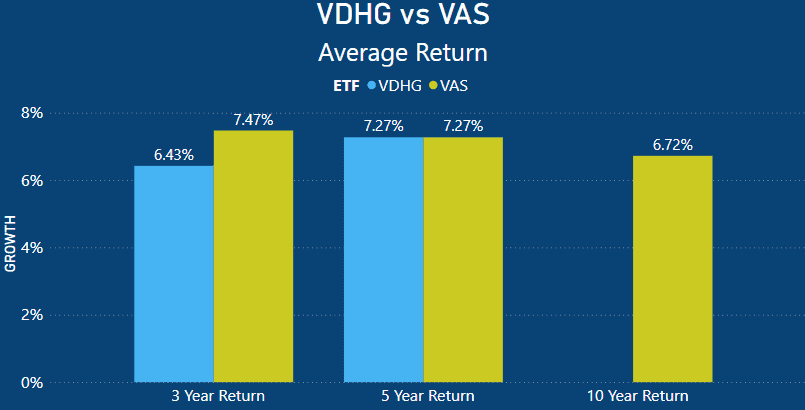
When we analyze the average returns of both VAS and VDHG, it’s quite intriguing. We can observe that VDHG has had some standout years compared to VAS.
Surprisingly, VAS has outperformed VDHG in terms of the average 3-year return. VAS returned 7.47%, while VDHG returned 6.43%, resulting in a performance difference of 1.04%.
This difference can be attributed to the fact that, as previously noted, VDHG experienced a nearly 10% loss in 2022, whereas VAS only had a 1.68% loss. Interestingly, the average 5-year return is identical for both at 7.27%.
VDHG has not been in existence for 10 years, so it lacks a 10-year average return. However, VAS, introduced in 2009, does have a 10-year average return of 6.72%.
VDHG vs VAS ETF Holdings
ETFs are comprised of a selection of individual stocks that serve as the core assets within the ETF.
The makeup of an ETF is primarily determined by the index it aims to replicate, its investment objectives, and occasionally specific screening criteria, such as ESG considerations.
In certain cases, specific ETFs may allocate larger proportions of their investments to particular stocks. This is evident in VAS, for instance.
Although VAS holds portfolios with over 300+ equities, a significant portion of its investments is focused on a select few stocks.
Conversely, some ETFs adopt an equal-weighting strategy in which all the underlying stocks in the ETF are given equal significance.
This approach ensures that if one stock outperforms while others underperform, a process known as “rebalancing” is applied to maintain equal weighting.
An example of such an Australian ETF is Vaneck’s MVW. I provide a more detailed examination of this topic in my review comparing MVW vs VAS – What Is The Best Australian ETF?
VAS Top 10 Holdings
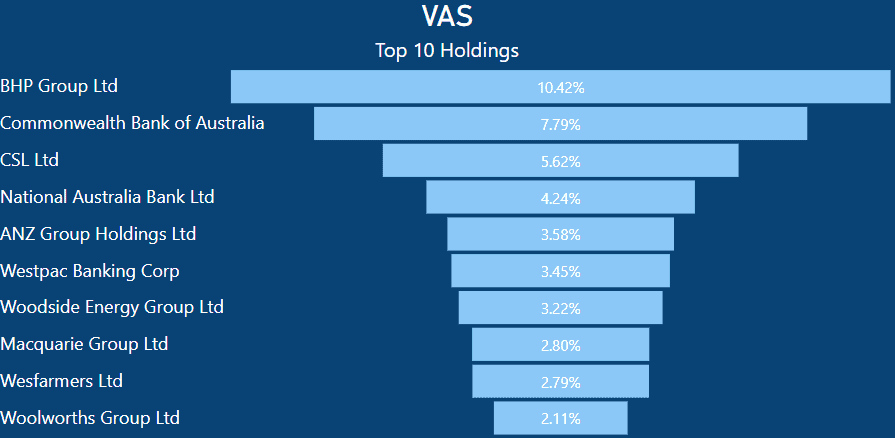
VAS maintains substantial investments in various Australian companies, and BHP emerges as its foremost holding.
It assigns 10.42% of its portfolio to BHP, signifying that for every $1000 invested in VAS, you would have holdings worth $104.20 in BHP shares.
Similarly, the Commonwealth Bank of Australia (CBA) constitutes 7.79% of VAS’s holdings. As with BHP, a $1000 investment in VAS would translate to holdings valued at $79.79 in CBA shares.
Given the substantial market capitalization of both mining and banking entities on the ASX, it’s not surprising that VAS carries significant weight in these sectors. VAS includes five banks within its top 10 holdings, collectively accounting for 21.86% of the entire ETF.
Interestingly, when you add up the total percentage of VAS’s top 10 holdings, they amount to 46.02%. This indicates that the top 10 stocks alone contribute to nearly half of the entire ETF.
VDHG Top 10 Holdings
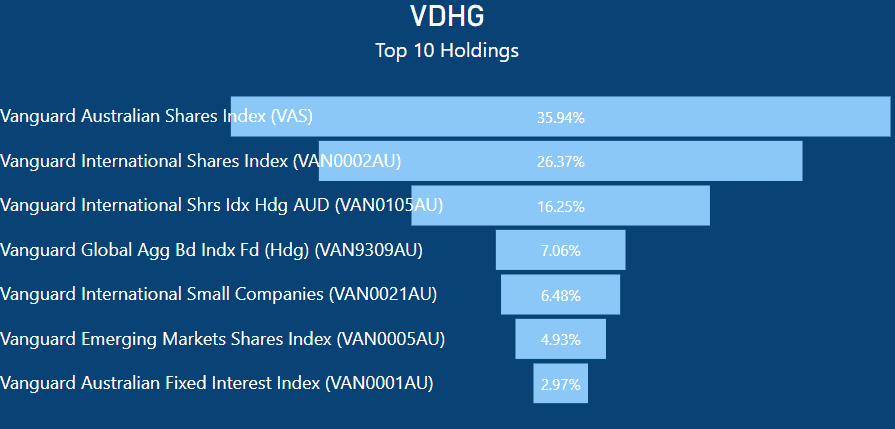
The primary composition of the VDHG ETF consists of index funds, and notably, it includes VAS within its holdings. The most significant allocation in VDHG is devoted to VAS, representing 35.94% of its portfolio.
In addition to VAS, VDHG’s allocations encompass international shares index at 26.73%, along with a hedged version at 16.25%.
Regarding investments in the international shares index, hedging is a strategy employed to mitigate the impact of currency exchange rate fluctuations on investment returns.
VDHG also designates 6.48% of its holdings to small-cap companies and 4.93% to emerging markets. Notably, where VDHG diverges from DHHF is in its fixed-income allocations.
VDHG allocates 7.06% to hedged index bonds and 2.97% to Australian fixed interest.
VDHG vs VAS – Asset Allocation

When you contrast the asset allocation of VAS with that of VDHG, it becomes apparent that VAS follows a much simpler strategy. VAS allocates a substantial 94.1% to domestic equities, with a minor allocation of 5.48% in listed property, and a very modest remainder in cash.
 In a comparison with VDHG, VAS invests 34.19% in domestic equities and a significant 52.67% in international equities.
VDHG also diversifies its portfolio by investing in international fixed interest, representing 6.89% of its allocation, while domestic fixed interest makes up 3.16% of the total allocation.
Furthermore, VDHG designates 3% to listed property.
Summary – VDHG vs VAS Which Suits Best?
When it comes down to it, VDHG and VAS are two very distinct ETF products. VAS offers a straightforward allocation, encompassing the top 300 listed companies in Australia, albeit with over 10% of its holdings concentrated in BHP alone.
On the other hand, VDHG is a multifaceted investment. It directly invests in VAS, which accounts for over a third of the entire ETF. The remaining allocations are in international and emerging markets, which is where the differences become quite pronounced.
These international markets also include emerging and developing markets, as well as small-cap companies. Growth in these markets is typically more volatile and can potentially influence VDHG’s performance significantly.
When you break down VDHG, it serves as a robust investment for those seeking a “set and forget” strategy. It offers a well-rounded approach, encompassing fixed interest, bonds, Australian and international market exposure, covering all the bases.
Personally, I have a prefer for a different option. VAS, or any Australian ETF, will always be a core element of my portfolio, combined with other international ETFs like IVV vs IOO or IVV vs VGS.
The choice of which Australian ETF to include is less critical, with the exception of MVW. Through head-to-head comparisons, only MVW has consistently delivered superior performance; the others are nearly identical in their results.
With all that being said, if you’re looking for a “set and forget” ETF, VDHG is a solid choice.
However, if you prefer flexibility and want to have more control over your investments, you can opt for a domestic ETF in combination with other international ETFs to achieve a similar investment approach as VDHG.
This article does not serve as an endorsement or recommendation for products mentioned in the article. The information presented here is based on referenced sources and is accurate as of the date of October 22, 2023. Please note that these articles are written sometime before their publication date.
The information provided in this content is for informational purposes only and should not be considered as financial, investment, or professional advice. We recommend consulting with a qualified expert or conducting your own research before making any financial decisions.
The accuracy, completeness, or reliability of the information cannot be guaranteed, and the provider shall not be held responsible for any actions taken based on the information contained in this content.