
VAS ETF Review: Your Guide to Australia’s Largest ETF
Last Updated on 20 February 2024 by Ryan Oldnall
The Vanguard Australian Shares Index ETF (ASX: VAS), or as it’s more commonly known, VAS, is Australia’s largest ETF. VAS has over $12 billion in assets under management and provides investors with a broad exposure to the top 300 listed companies in Australia [1].
In this review, we take a closer look at what’s under the hood of the VAS ETF, its general performance, and how it compares against the index it follows.
What is the VAS ETF?
The VAS ETF is a cost-effective investment option with a low management fee of 0.07% per annum. It operates as an index-based exchange-traded fund, aiming to replicate the S&P ASX 300 index.
This index comprises 300 of the largest Australian companies, determined by their market capitalization. It encompasses a diverse range of ASX shares, spanning from banks and mining companies to retailers and healthcare firms.
VAS ETF Performance Chart & VAS ETF Share Price
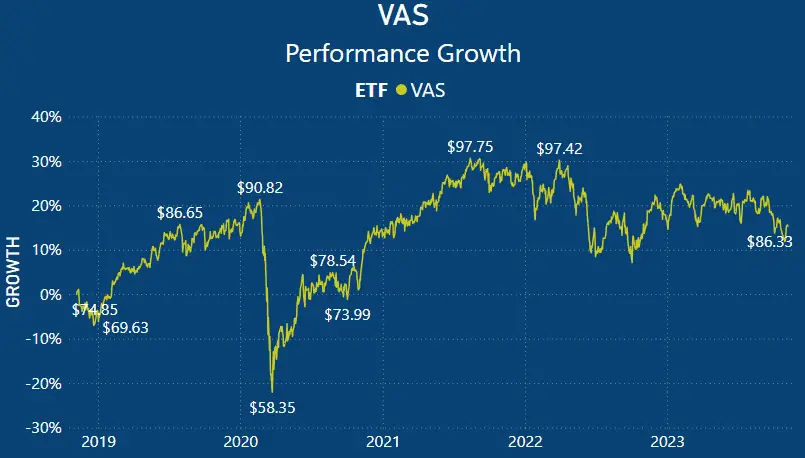
When examining the performance of VAS, it reveals a pattern of peaks and valleys, along with a recent period of stagnation. Starting in late 2018, the performance took a dip, followed by a subsequent increase.
In early 2020, the ETF experienced a sharp decline in growth, driven by the global and Australian COVID-19 lockdowns. However, it managed to recover a significant portion of the lost gains.
In 2021, both the VAS ETF and the overall market enjoyed a rally, reflecting increased demand in various sectors and additional investments in economies worldwide.
The performance of the VAS ETF in 2022 and 2023 has been relatively lacklustre, with a poor showing in 2022 and a continued underwhelming performance in 2023.
VAS ETF Share Performance
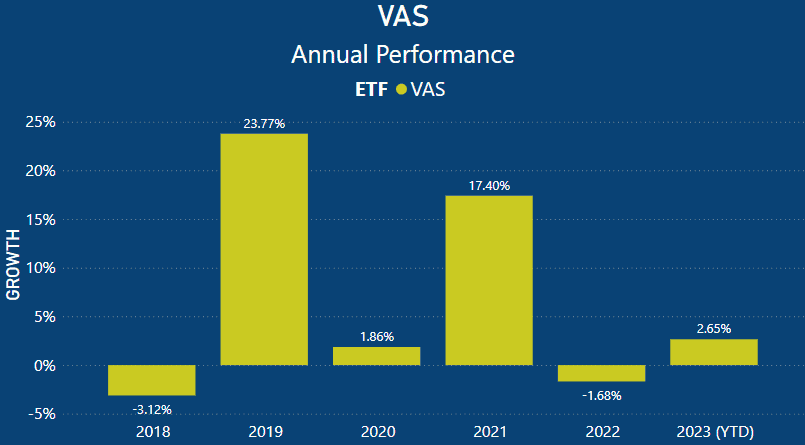
When analyzing the annualized performance of the VAS ETF, we can observe an overall performance loss in 2018, amounting to -3.12%.
In 2019, the VAS ETF delivered an outstanding performance, posting a gain of 23.77%, but in 2020, it exhibited more modest growth at 1.86%.
Given the economic challenges posed by the onset of the COVID-19 pandemic, a 1.86% performance was acceptable to many investors.
Following the easing of international travel restrictions, the VAS ETF saw significant growth of 17.40%. However, this performance declined in 2022 due to factors such as the conflict in Ukraine, rising inflationary costs, and concerns about a potential global recession.
As of YTD 2023, the VAS ETF has grown by just 2.65%. It has experienced a relatively stagnant year, influenced by factors like escalating cost of living concerns, persistent inflation, and elevated home loan interest rates.
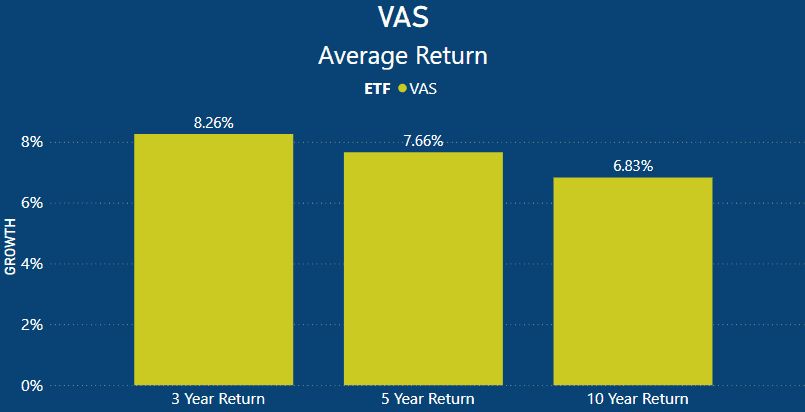
When viewing the ETF’s performance over an extended period, we can observe that the 10-year return of 6.83% is significantly lower than the 3-year return. This discrepancy is primarily due to some exceptional performance years for VAS.
Had the VAS ETF exhibited stronger performance in 2022 and 2023, this figure would be considerably higher. Similarly, the VAS ETF’s 5-year return of 7.66% is a commendable result for that time frame.
For context, the S&P/ASX 300’s average total return over 3 years is 8.16%, and VAS has outperformed this benchmark. Likewise, the 5-year total return is 7.52%, with VAS surpassing the index by 0.14%.
Lastly, when comparing the 10-year average total return, VAS slightly underperformed the index’s annualised return by 0.02%, with the S&P/ASX 300 achieving a return of 6.85% [2].
VAS ETF Dividend
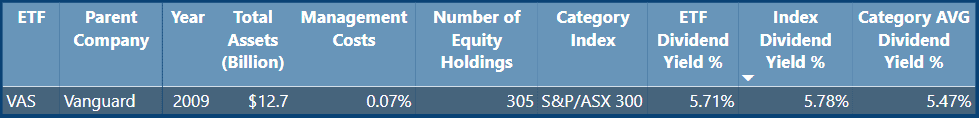
If you’re a current VAS ASX investor, you’re likely familiar with the decent yield the ETF provides on a quarterly basis. VAS currently yields 5.71%, which is slightly below the index dividend yield of 5.78% but higher than the category average of 5.47%.
VAS distributes its yield, or distribution as it’s known in the context of ETFs, on a quarterly basis. Additionally, VAS has the added benefit of being domiciled in Australia, which reduces paperwork for investors.
If you’re interested in exploring other high-dividend-yielding ETFs, you can find more information in my other articles.
VAS ETF Holdings
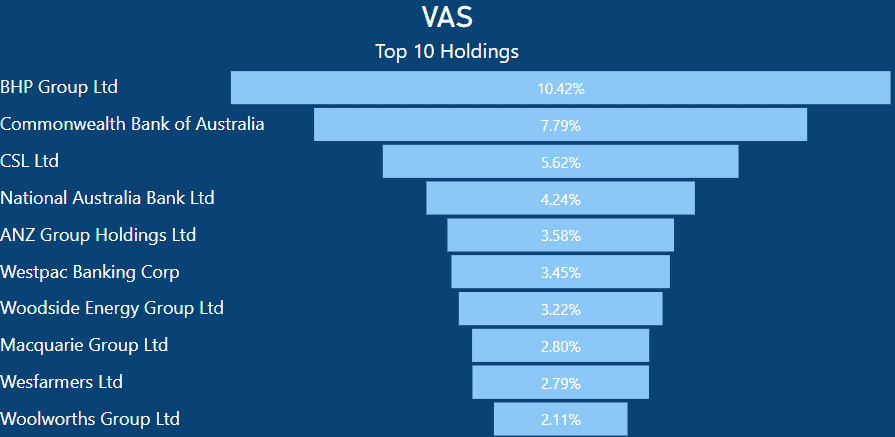
VAS has significant weightings in Australia’s largest companies. This is to be expected because VAS invests on a market-capitalised basis. Consequently, the larger the company, the more significant its presence in the VAS ETF.
VAS’ top 10 holdings are less diversified than some investors might find uncomfortable.
Notably, BHP and CBA have consistently held top positions in VAS’s holdings, which is unsurprising as they are among Australia’s largest and most well-known brands and companies.
As previously mentioned, I have discussed that the Australian share market is dominated by banks and miners, and this influence is evident in these holdings. In VAS’s top 10 holdings, half of them are comprised of banks alone.
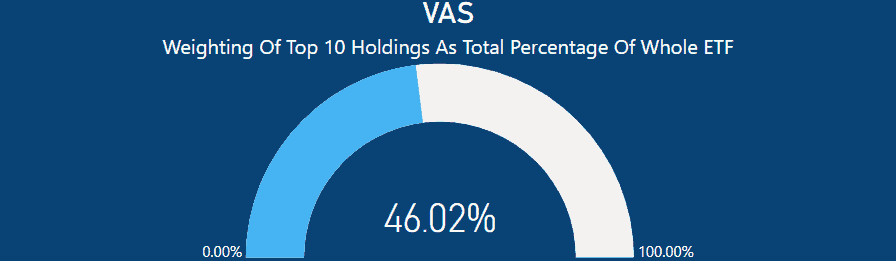
When we assess these same top 10 holdings as a percentage of VAS as a whole, they make up 46.02%. In other words, these 10 companies collectively account for nearly half of the VAS ETF.
This leaves only 53.98% for the other 295 equity holdings. Despite the VAS ETF’s investment in the ASX 300, a significant portion of the ETF is concentrated in just a few companies. This concentration is a common occurrence and a trend I have observed in many of my reviews.
Summary – Is VAS ETF A Good Investment
Is VAS a good investment? In my opinion, yes, it’s a very solid investment. VAS invests in Australia’s top 300 companies and has done an excellent job of matching or outperforming the index.
In some cases, you can observe that some ETFs fail to match the performance of their underlying index. With VAS, you get both performance growth and dividend yields.
Should you choose VAS over ASX tracking ETFs?
Ultimately, this decision comes down to personal preference. I have conducted numerous head-to-head comparisons, and MVW is the only ETF that offers something distinct from the rest. You can find those comparisons below.
This article does not serve as an endorsement or recommendation for products mentioned in the article. The information presented here is based on referenced sources and is accurate as of the date of November 7, 2023. Please note that these articles are written sometime before their publication date.
The information provided in this content is for informational purposes only and should not be considered as financial, investment, or professional advice. We recommend consulting with a qualified expert or conducting your own research before making any financial decisions.
The accuracy, completeness, or reliability of the information cannot be guaranteed, and the provider shall not be held responsible for any actions taken based on the information contained in this content.