
STW vs VAS: Australia’s First Ever ETF and Vanguard’s Best
Last Updated on 3 March 2024 by Ryan Oldnall
Investors in the Australian ETF market are likely familiar with Vanguard Australian Shares Index ETF (ASX: VAS) and SPDR S&P/ASX 200 Fund (ASX: STW).
Both companies are well-known in the American ETF Market for their hugely popular US ETFs VOO and SPY.
STW and VAS are among the ETF options that seek to match the performance of the S&P/ASX 200 and S&P/ASX 300.
Many investors want to have a domestic ETF that replicates the Australian share market’s performance in their investment portfolio.
Deciding between these choices can be tough. In this article, we’ll directly assess STW and VAS to help you select the right ETF for you.
VAS tracks the ASX 300, including the top 300 Australian companies, while STW tracks the ASX 200, representing the top 200 Australian companies. Which option delivers better results?
Vanguard VAS Review
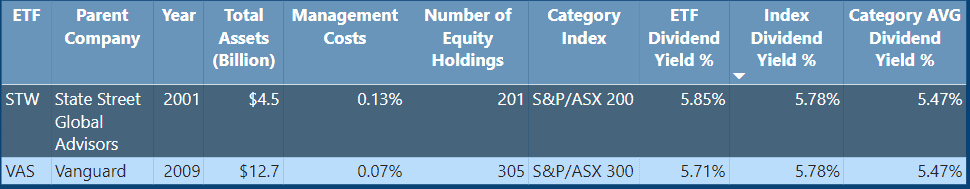
VAS, Vanguard’s Australian Shares Index ETF, holds the title of Australia’s most popular ETF. It closely mirrors the S&P/ASX 300, which consists of the 300 leading companies listed on the ASX. Currently, one unit of the VAS ETF is priced at $85.33, and it is domiciled in Australia.
Vanguard is a globally recognized investment management firm with a strong reputation, serving a vast investor base of over 50 million individuals worldwide. VAS, on its own, manages a substantial $12.7 billion in assets [1]
Vanguard has been a prominent player in the Australian market since 1996 and introduced VAS, one of its initial ETF offerings, in 2009. On a global scale, the company oversees a colossal A$10 trillion in assets [1],[2].
Vanguard’s ongoing presence in the Australian market is evident by the recent launch of a super fund in October 2022, which I have extensively reviewed in my Vanguard Super Review.
SPDR STW Review
STW, the SPDR S&P/ASX 200 Fund, made its debut in August 2001. It closely follows the S&P/ASX 200, comprising the top 200 Australian companies.
STW is an Australian-domiciled ETF currently priced at $62.13, distributing its earnings on a quarterly basis. Notably, SPDR STW holds the distinction of being the first ever exchange-traded fund to be listed in Australia [3].
In terms of assets under management (AUM), STW accounts for about a third of VAS, with a respectable $4.5 billion in AUM.
State Street Global Advisors, the entity behind SPDR STW, is the fourth-largest asset manager globally, overseeing a total of $3.5 trillion in assets as of December 31, 2022 [4].
ETF Management Fees
Management fees for ETFs encompass the annual expenses associated with supervising and promoting investments in ETFs. Typically, these fees represent a minor fraction of your investment and can affect your overall returns.
It is advisable to opt for ETFs with lower fees since this ensures that a larger portion of your profits remains in your possession.
ETFs are renowned for their cost-efficiency when compared to other investment alternatives. To gain a clearer understanding of the fee structure, it is crucial to examine the Product Disclosure Statement (PDS) of an ETF.
VAS distinguishes itself by offering one of the most competitive fee structures in the Australian ETF market, even when compared to competitors like BetaShares A200.
VAS recently reduced its management fee from 0.10% to 0.07%, effective from July 3, 2023. This implies that, for a $10,000 investment in VAS ETFs, you would incur $7 in fees.
In contrast, STW imposes a higher ETF management fee of 0.13%, resulting in $13 in fees for a $10,000 investment.
This stands as the highest ASX ETF fee I have reviewed, with the exception of VanEck Australian Equal Weight ETF (ASX:MVW), which sits at 0.35%.
VAS Dividend History
As an Australian investor, you’re likely searching for an ETF that offers dividends, and VAS does produce a dividend despite this not being its primary focus.
VAS has a robust dividend track record, delivering a yield of 5.71%. This yield is slightly lower than the index average of 5.78% but better than the category average of 5.47%.
VAS, like STW, pays its distribution on a quarterly basis. Additionally, VAS is domiciled in Australia, bringing the added benefit of streamlined paperwork and overall management convenience.
STW Dividend History
Like many other Australian ETFs, STW offers a dividend with a yield of 5.85%, which is better than VAS’s 5.71% dividend yield.
In fact, STW’s yield surpasses the averages of both the index and the category, outperforming them by 0.07% and 0.38%, respectively.
VAS vs STW – 5 Year Annual Performance Comparison
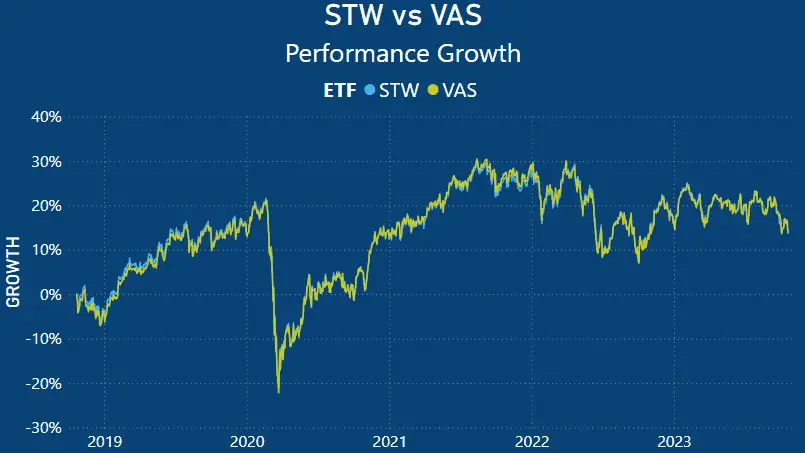
Examining the performance trend over the last five years, starting in late 2018, it becomes evident that the performance of STW and VAS exhibit a striking resemblance, despite VAS tracking the ASX 300 and STW following the ASX 200.
Both ETFs underwent substantial declines during the COVID-19 pandemic in 2020, followed by a rebound in the latter part of that year, maintaining that growth through 2021.
However, in 2022, they experienced a downturn, and in 2023, their performance has somewhat stagnated.
STW vs VAS Average 3 Year, 5 Year and 10 Year Return
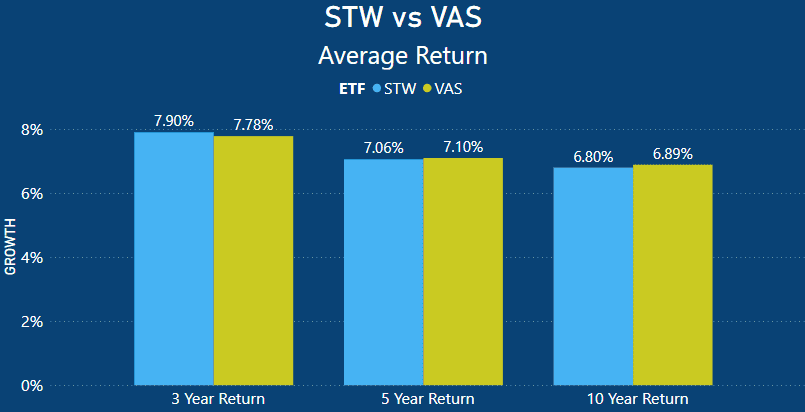
When evaluating the average returns of both VAS and STW, it becomes apparent that their average performance results are almost identical.
Over a 3-year period, STW achieved a return of 7.90%, slightly outpacing VAS’s 7.78% by a slim margin of 0.12%.
In the medium-term 5-year performance, VAS once again edged out STW, but this time by a mere 0.04%. VAS registered a 5-year average return of 7.10%, compared to STW’s 7.06%.
However, when assessing the more extended 10-year time frame, VAS actually delivered a superior outcome, with a 6.89% average return. This stands 0.07% higher than STW’s 6.80% return over the same 10-year period.
STW vs VAS Annual Performances
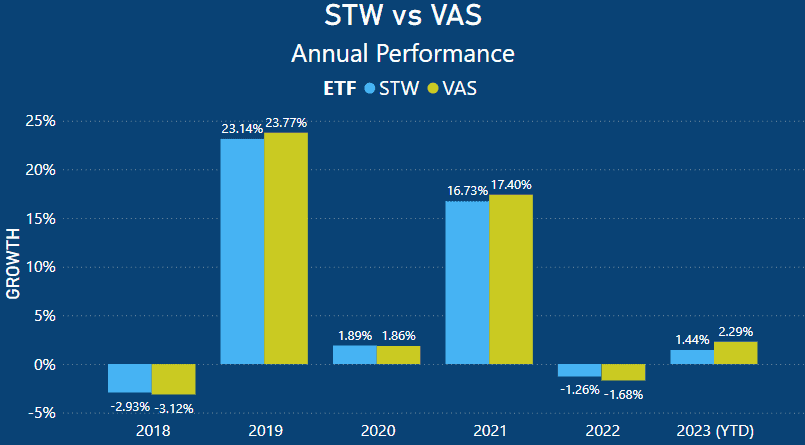
When we dissect the annual performance figures, we can observe the similar returns in their year-by-year results. Looking at the years from 2018 to 2023 (Year-to-Date), it’s visually apparent that VAS demonstrates stronger performance in the years of growth.
This correlation is backed by VAS’ higher 10-year average overall. However, as we’ve noticed, STW exhibited slightly stronger 3-year average returns, while VAS had the slightly higher 5-year average returns.
This difference arises from the fact that in years when the ASX experienced value declines, VAS suffered more slightly greater losses compared to STW. This explains VAS’s lower 3-year average return.
However, when assessing the 5 and 10-year average returns, VAS’ performance wins out, with a noticeable lead over STW in 2023 Year-to-Date.
VAS has outperformed STW by 0.85%, achieving a return of 2.29% compared to STW’s 1.44%.
The performance of both VAS and STW in 2023 has been underwhelming, with the Australian stock market experiencing a year of stagnation.
Australia grapples with persistent challenges, including elevated inflation rates, rising living expenses, and consistently high interest rates.
ETF Holdings
ETFs are comprised of a collection of individual stocks that serve as the fundamental assets within the ETF.
The composition of an ETF primarily depends on the index it aims to replicate, its investment objectives, and occasionally specific screening criteria, such as ESG considerations.
In certain cases, particular ETFs may allocate a larger share of their investments to specific stocks. This is the situation with both VAS and STW ETFs.
Despite having portfolios that consist of 200 to 300+ equities, a significant proportion of their investments is concentrated in a select few stocks.
Conversely, some ETFs adopt an equal-weighting strategy, where every underlying stock in the ETF carries equal significance.
This approach ensures that in the event one stock outperforms while others underperform, a process known as “rebalancing” is employed to maintain equal weighting.
An example of such an Australian ETF is Vaneck’s MVW. I offer a more comprehensive exploration of this subject in my review MVW vs VAS – What Is The Best Australian ETF?
VAS Top 10 Holdings

VAS has significant investments in various Australian companies, with BHP being its largest holding, constituting 10.42% of its portfolio. This means that for every $1000 invested in VAS, you would have $104.20 worth of BHP shares.
Similarly, the Commonwealth Bank of Australia (CBA) makes up 7.79% of VAS’s holdings. So, a $1000 investment in VAS would result in $79.79 worth of CBA shares.
Given the substantial market capitalization of mining and banking entities in the ASX, it’s not surprising that VAS has a significant presence in these sectors.
In fact, VAS includes 5 banks in its top 10 holdings, which collectively account for 21.86% of the entire ETF.
STW Top 10 Holdings
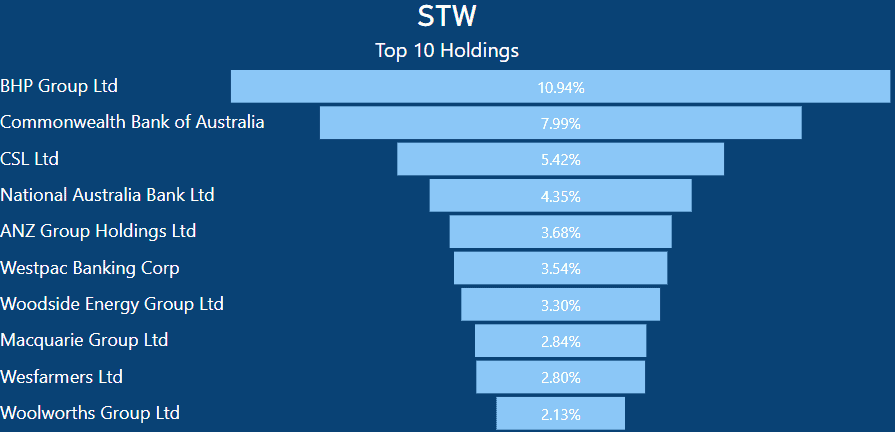
STW’s top 10 holdings mirror those of VAS exactly, with the only variation being the allocation percentages. To illustrate, STW designates 10.94% to BHP, meaning that a $1000 investment would yield $109.40 worth of BHP shares.
This allocation is slightly higher than VAS’s 10.42% allocation to BHP. The identical composition of their top 10 holdings likely accounts for the minimal disparity in the overall performance of both ETFs.
In my comparison of IOZ vs VAS, it was noted that the holdings in these ETFs were also identical.
VAS vs STW – Top 10 Holdings As Total Percentage of ETF
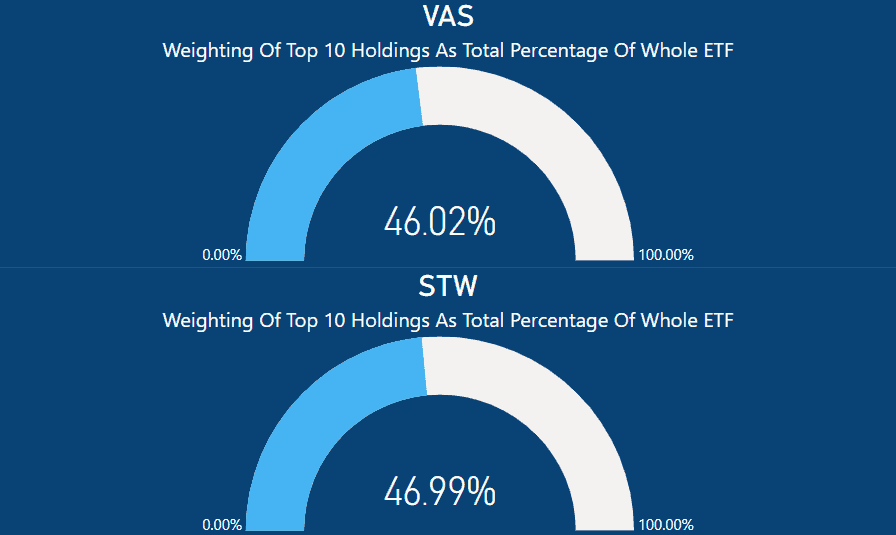
The breakdown of the top 10 holdings in each ETF reveals a near-identical total weighting. In both VAS and STW, these top 10 holdings represent a substantial portion of the entire ETF.
For STW, this translates to 46.99% of the ETF’s composition, even though STW holds a total of 201 equities at present.
In the case of VAS, the top 10 stocks make up a significant 46.02% of the entire ETF. This is noteworthy, especially considering VAS’s focus on the ASX 300, which includes the top 300 Australian companies.
I’ve previously conducted comparisons of VAS with other Australian ETFs in my articles, such as A200 vs VAS, ,VHY vs VAS, IOZ vs VAS, and MVW vs VAS.
STW vs VAS – Market Cap Analysis
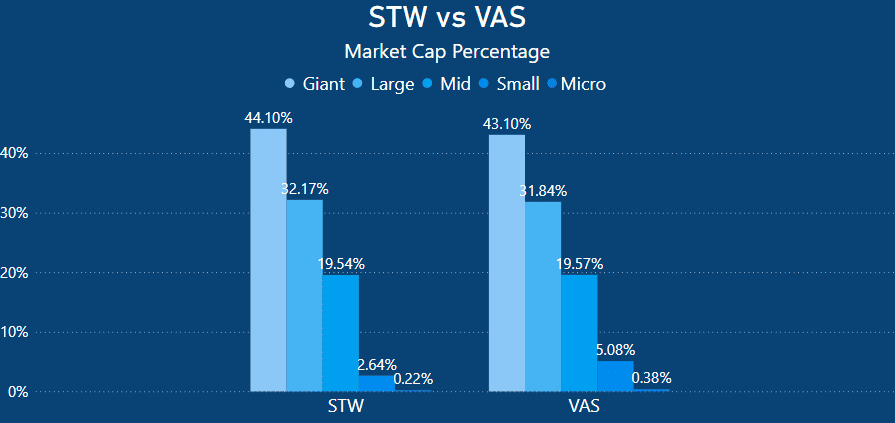
When we look at VAS’s investments in the top 300 companies it invests very similar to STW. VAS dedicates 43.10% to major Australian companies, while STW allocates a slightly higher percentage at 44.10%.
Both ETFs display significant weightings in large-cap companies, with STW at 32.17% and VAS at 31.84%.
It’s important to highlight that neither VAS nor STW places substantial investments in small and micro-cap companies. When comparing them both, VAS has the highest market cap allocation to small caps at 5.08%, whereas STW allocates only 2.64% to this category.
This difference can largely be attributed to VAS investing in the ASX 300 while STW focuses on the ASX 200.
Summary – So which is better STW or VAS? Does STW Justify its fees?
When you’re considering the right Australian ETF for your investment allocation, both STW and VAS are viable options.
Their performances are quite similar, with VAS showing a slightly higher 10-year average performance, albeit by a narrow margin of 0.07%.
In my view, the primary factor to weigh when comparing these ETFs is the management fee. I have reviewed all the major Australian ETFs that track the ASX 200/300. STW has the highest ETF management fee out of all these ETFs with the exception of MVW.
It’s worth noting that MVW has the highest fee, but it follows a unique equal-weighting approach.
Here’s a breakdown of the expense ratios for these five ETFs:
- BetaShares A200 charges 0.04%
- iShares IOZ charges 0.05%
- Vanguard VAS charges 0.07%
- SPDR STW charges 0.13%
- VanEck MVW charges 0.35%
Another metric worth taking into account is Morningstar’s performance growth analysis. If you had invested $10,000 in VAS a decade ago, it would now be valued at $23,443 [5].
Investing the same amount in STW over the same period would result in a value of $23,313, making VAS $130 more profitable than STW over the course of 10 years [6].
Considering the performance differences among these five ETFs, it’s challenging to justify the higher cost of STW.
- https://www.vanguard.com.au/corporate/
- https://www.vanguard.com.au/personal/invest-with-us/etf?portId=8205
- https://www.ssga.com/au/en_gb/intermediary/etfs/funds/spdr-spasx-200-fund-st
- https://annualreport.statestreet.com/Y2022/Details/2022/investment-management/default.aspx
- https://www.morningstar.com.au/investments/security/ASX/VAS/performance
- https://www.morningstar.com.au/investments/security/ASX/STW/performance
This article does not serve as an endorsement or recommendation for products mentioned in the article. The information presented here is based on referenced sources and is accurate as of the date of October 22, 2023. Please note that these articles are written sometime before their publication date.
The information provided in this content is for informational purposes only and should not be considered as financial, investment, or professional advice. We recommend consulting with a qualified expert or conducting your own research before making any financial decisions.
The accuracy, completeness, or reliability of the information cannot be guaranteed, and the provider shall not be held responsible for any actions taken based on the information contained in this content.