IOZ vs VAS: A Battle of Aussie ETFs
Last Updated on 26 February 2024 by Ryan Oldnall
If you’re an ETF investor, it’s likely you’re acquainted with the Vanguard Australian Shares Index ETF (ASX: VAS) and the iShares Core S&P/ASX 200 ETF (ASX: IOZ).
These two Australian ETFs are recognized for their cost-effectiveness and their ability to mirror the performance of the popular Australian Securities Exchange (ASX).
Many investors prefer to include a domestic ETF in their portfolio that mirrors Australian shares. However, making a decision between the two can be challenging.
This article will provide a direct comparison of IOZ vs VAS, offering insights to assist you in determining which one is the better choice for your investment.
Considering that VAS tracks the ASX 300 (the top 300 Australian companies) and IOZ tracks the ASX 200 (the top 200 Australian companies), which of these options yields the most best results?
Vanguard VAS Review
Vanguard’s Australian Shares Index ETF, VAS, is Australia’s most popular ETF, closely tracking the S&P/ASX 300, which includes the top 300 ASX-listed companies. A single VAS ETF unit currently costs $85.33 and is domiciled in Australia.
Vanguard, a globally renowned investment management firm with a strong track record, serves over 50 million investors worldwide, with VAS alone having $12.7 billion in assets under management [1].
Vanguard has been a prominent player in the Australian market since 1996, introducing VAS, as one of its initial ETFs, in 2009. Globally, the company manages over A$10 trillion in assets [1],[2].
Vanguard’s presence in the Australian market is further evident through the recent introduction of a super fund in October 2022, leading to my comprehensive Vanguard Super Review.
iShares IOZ Review
iShares Core S&P/ASX 200 ETF, IOZ, was introduced in 2010, and it tracks the S&P/ASX 200, consisting of the top 200 Australian companies.
IOZ, domiciled in Australia, is also priced at $27.75, which is more than three times less than a VAS ETF.
It’s important to note that a higher ETF price doesn’t necessarily mean it’s more or less valuable. For example, if you have one ETF worth $100 and it increases by 10%, it becomes worth $110.
In contrast, if you have 10 ETFs, each worth $10, and they all increase by 10%, you’ll have 10 ETFs worth $11 each, which is equivalent in total value to the one ETF worth $110.
iShares is one of the world’s largest ETF providers, offering over 1,250 products worldwide [3]. iShares serves approximately 120 million investors worldwide, with $2.5 USD trillion in assets under management [4].
IOZ has about a third of the assets under management compared to VAS, with a respectable $4.4 billion in AUM.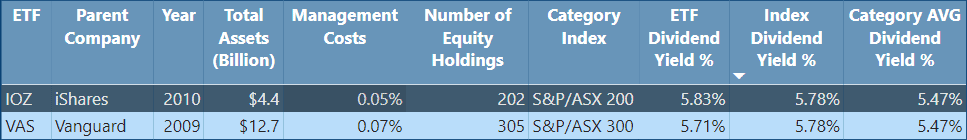
IOZ vs VAS ETF Management Fees
ETF management fees cover the annual costs associated with overseeing and promoting investments in ETFs. Typically, these fees make up a small portion of your investment, impacting your overall returns.
Choosing ETFs with lower fees is recommended, as it ensures that a larger portion of your earnings stays in your pocket.
ETFs are well-known for their cost-effectiveness when compared to other investment options. To better understand the fee structure, it’s essential to review an ETF’s Product Disclosure Statement (PDS).
VAS and IOZ stand out by offering some of the most competitive fees in the Australian ETF market, even when compared to competitors like BetaShares A200.
VAS recently lowered its management fee from 0.10% to 0.07%, starting on July 3, 2023. This means that for a $10,000 investment in VAS ETFs, you would pay $7 in fees.
On the other hand, IOZ has a slightly lower ETF management fee at 0.05%, resulting in $5 in fees for a $10,000 investment.
Both VAS and IOZ provide excellent value with remarkably low ETF management fees that continue to decrease as competition for market share intensifies.
VAS Dividend History
If you’re an Australian investor, it’s likely that you’re looking for an ETF that provides dividends, and VAS certainly meets this requirement.
VAS has an impressive dividend history, with a yield of 5.71%. This yield compares favorably to the index average of 5.78% and the category average of 5.47%.
One of the advantages of VAS is that it distributes its dividends on a quarterly basis, providing investors with a regular income stream. Furthermore, being domiciled in Australia brings the added benefit of reduced paperwork and easier overall management.
IOZ Dividend History
Similar to other Australian ETFs, IOZ provides a dividend with a yield of 5.83%, which is slightly superior to VAS’s dividend yield of 5.71%.
In fact, IOZ’s yield exceeds the averages of both the index and the category, outperforming them by 0.05% and 0.36%, respectively.
VAS vs IOZ – 5 Year Annual Performance Comparison
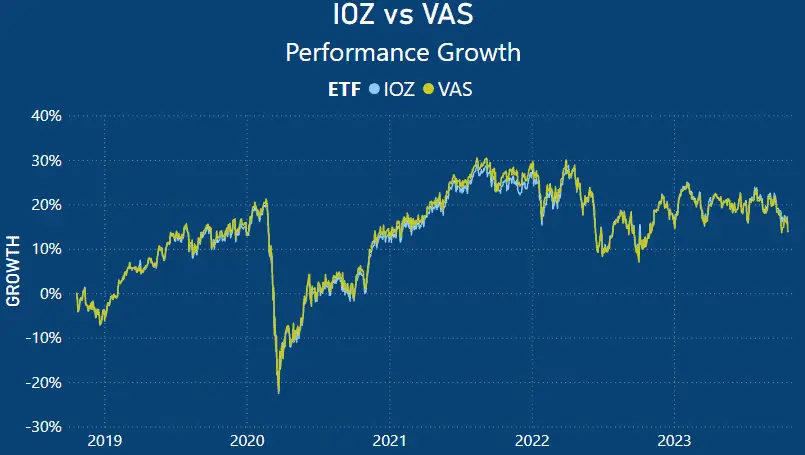
Analyzing the performance trend over the past five years, commencing in late 2018, it’s apparent that the performance of IOZ and VAS is remarkably similar, even though VAS tracks the ASX 300 and IOZ the ASX 200.
Both experienced significant losses during the COVID-19 pandemic in 2020, rebounding in the latter part of the year and maintaining that growth into 2021, then declining in 2022 and somewhat leveling off in 2023.
IOZ vs VAS Average 3 Year, 5 Year and 10 Year Return
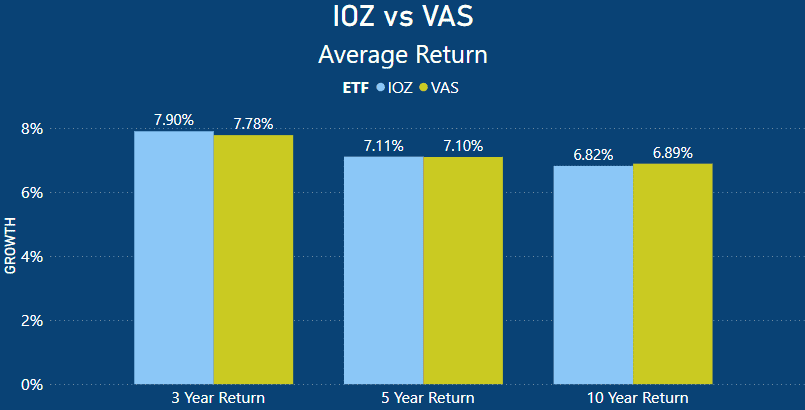 When we examine the average returns of both VAS and IOZ, it’s evident that their average performance returns are nearly identical.
Over a 3-year period, IOZ achieved a return of 7.90%, slightly surpassing VAS’s 7.78%, with a difference of 0.12%.
In the medium-term 5-year performance, IOZ again outperforms VAS by a mere 0.01%. IOZ posted a 5-year average return of 7.11% compared to VAS’s 7.10%.
However, when considering the longer 10-year time frame, VAS actually returned a better result with a 6.89% return. This is 0.07% higher than IOZ’s 6.82% 10 year return.
IOZ vs VAS Annual Performances
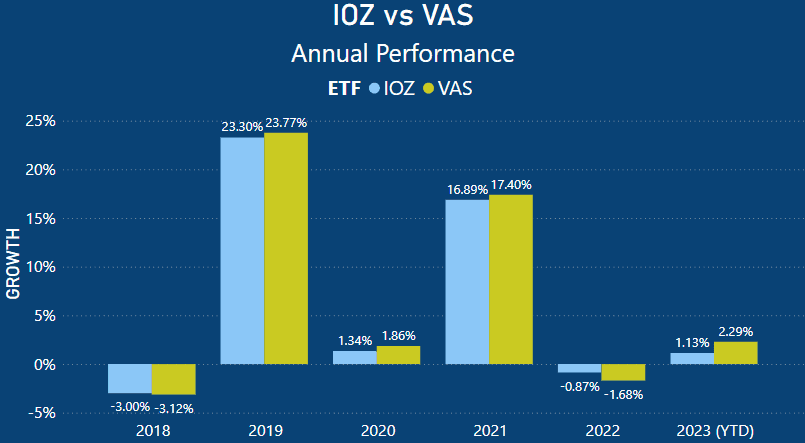
When we break down the performances on an annual basis, we can see how closely the performances align year after year. When looking at 2018 – 2023 (YTD), we can visually see that VAS has had stronger performances in years when it has grown.
This is supported by the higher overall 10-year average. However, as we have seen, IOZ had slightly stronger 3 and 5-year average returns.
This is because, as we have observed, in years when the ASX has lost value, VAS has sustained greater losses than IOZ. Therefore, this explains why VAS has the lower 3 and 5-year losses, as the ASX has had 2 down years in that period.
The performance of both VAS and IOZ in 2023 has been disappointing. The Australian stock market has stagnated with a tumultuous year.
Australia continues to grapple with high inflation rates, rising living costs, and persistently high interest rates.
IOZ vs VAS ETF Holdings
ETFs consist of a collection of individual stocks that form the core assets within the ETF. The composition of an ETF primarily hinges on the index it seeks to replicate, its investment goals, and sometimes specific screening criteria such as ESG considerations.
In some instances, specific ETFs may allocate larger portions of their investments to particular stocks. This is the case for both VAS and IOZ ETFs.
Despite having portfolios of over 200-300+ equities, a significant portion of their investments is concentrated in select few stocks.
Conversely, certain ETFs employ an equal-weighting strategy, where all the underlying stocks in the ETF are given equal importance. This approach ensures that if one stock outperforms while others underperform, a process called “rebalancing” occurs to maintain equal weight.
An example of such an Australian ETF is Vaneck’s MVW. I provide a more detailed examination of this topic in my review comparing MVW vs VAS – What Is The Best Australian ETF?
VAS Top 10 Holdings
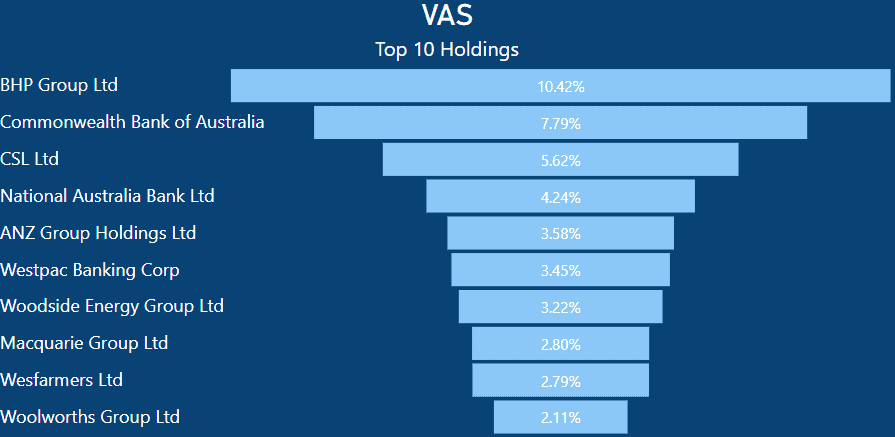 VAS maintains significant investments in various Australian companies, with BHP emerging as its top holding.
It allocates 10.42% of its portfolio to BHP, meaning that for every $1000 invested in VAS, you would have $104.20 worth of BHP shares.
In a similar manner, the Commonwealth Bank of Australia (CBA) makes up 7.79% of VAS’s holdings. Just like with BHP, if you had a $1000 investment in VAS, you would hold $79.79 worth of CBA shares.
Given the substantial market capitalization of both mining and banking entities in the ASX, it’s not surprising that VAS has significant weighting in these sectors. VAS includes 5 banks in its top 10 holdings, accounting for 21.86% of the entire ETF.
IOZ Top 10 Holdings

The top 10 holdings of IOZ precisely replicate those of VAS, with the sole distinction being their overall weighting. For example, IOZ assigns 11.03% to BHP, indicating that with a $1000 investment, you would have $110.30 worth of BHP shares.
This is slightly higher than VAS’s 10.42% allocation to BHP. The identical composition of the top 10 holdings likely contributes to the minimal difference in the overall performance of each ETF.
VAS vs IOZ- Top 10 Holdings As Total Percentage of ETF
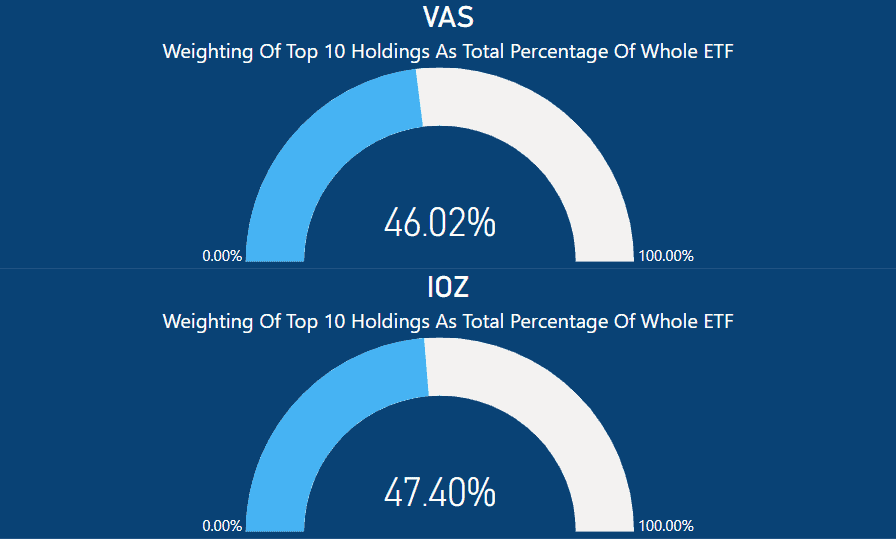
When we break down the collective composition of the top 10 holdings in each ETF, the findings are quite intriguing. Both VAS and IOZ have their top 10 holdings accounting for a substantial portion of the entire ETF.
In the case of IOZ, this translates to 47.40% of the ETF being comprised of just 10 stocks. It’s important to note that IOZ presently holds 202 equities in total.
For VAS, the top 10 shares make up a significant 46.02% of the entire ETF, which is notable given VAS’ focus on the ASX 300, encompassing the top 300 Australian companies.
I have previously conducted comparisons of VAS with other Australian ETFs in my articles, such as A200 vs VAS, VHY vs VAS, VAS vs VDHG and MVW vs VAS.
IOZ vs VAS – Asset Allocation
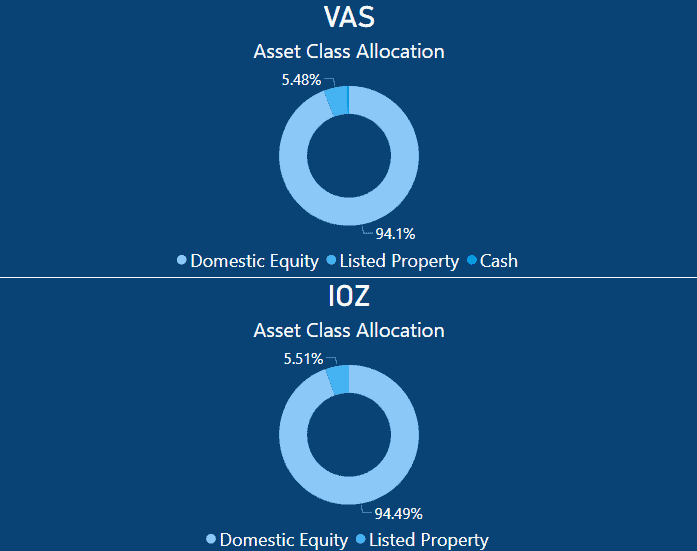
VAS and IOZ unsurprisingly have nearly identical allocations. VAS invests 94.1% in domestic equities, compared to IOZ’s 94.49%.
Both invest in listed property, with VAS allocating 5.48% and IOZ slightly more at 5.51%. VAS also has an insignificant amount invested in cash.
IOZ vs VAS – Market Cap
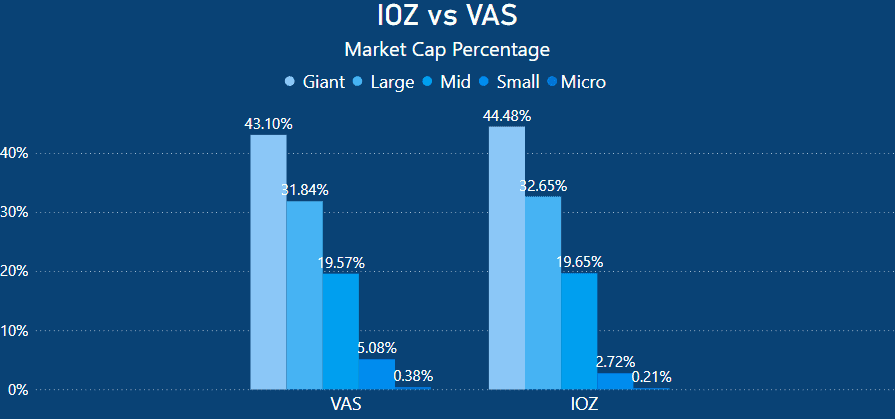
When it comes to VAS investing in the top 300 companies, you might find its market cap allocations to be intriguing. VAS assigns 43.10% to Australian giant-cap companies, whereas IOZ has a slightly higher allocation at 44.48%.
Both exhibit substantial weightings in large-cap companies, with VAS at 31.84% and IOZ at 32.65%.
It’s worth noting that neither VAS nor IOZ places heavy investments in small and micro-cap companies.
Summary – So which is better IOZ or VAS
When deciding on the right Aussie ETF for your allocation, both IOZ and VAS are suitable options. Their performances are quite similar, with VAS having a slightly higher 10-year performance, albeit by a small margin of 0.07%.
Considering the ETF fees, IOZ is the more cost-effective choice at 0.04%, while VAS recently decreased its fee to 0.07%. Some prefer VAS due to its investment in the ASX 300, but given the low percentages in the market cap analysis, it may not significantly impact overall results.
Another metric to consider is Morningstar’s performance growth analysis. If you had invested $10,000 in VAS a decade ago, it would now be worth $23,443 [5]. Investing the same amount in IOZ over the same period would yield $23,266, making VAS $177 more profitable than IOZ over the course of 10 years [6].
This demonstrates the overall similarity between these two ETFs.Another consideration is the total cost of purchasing each ETF.
With VAS priced in the mid to high $80s and IOZ in the high $20s, some individuals might favor the more affordable ETF to enable the acquisition of a larger quantity at once.
- https://www.vanguard.com.au/corporate/
- ,https://www.vanguard.com.au/personal/invest-with-us/etf?portId=8205
- ,https://www.ishares.com/us/about-us
- https://www.ishares.com/us/about-us/who-we-are#dominik-rohe
- https://www.morningstar.com.au/investments/security/ASX/VAS/performance
- https://www.morningstar.com.au/investments/security/ASX/IOZ/performance
This article does not serve as an endorsement or recommendation for products mentioned in the article. The information presented here is based on referenced sources and is accurate as of the date of October 22, 2023. Please note that these articles are written sometime before their publication date.
The information provided in this content is for informational purposes only and should not be considered as financial, investment, or professional advice. We recommend consulting with a qualified expert or conducting your own research before making any financial decisions.
The accuracy, completeness, or reliability of the information cannot be guaranteed, and the provider shall not be held responsible for any actions taken based on the information contained in this content.
Explore our latest articles on ETFs and Shares for more insights into the investment world!
- IVV vs VGS – An Investor’s Dilemma
- VGS vs QUAL: The Best Diversification ETF vs Quality Index
- NDQ vs FANG: Which Tech ETF Is Right For You?
- NDQ vs VGS: Harnessing Tech Potential And Global Opportunities
- VAS vs IVV: Maximizing Growth Potential With ASX and S&P500