IOZ ETF Review: Evaluating the Power of S&P/ASX 200
Last Updated on 20 February 2024 by Ryan Oldnall
The iShares Core S&P/ASX 200 ETF (IOZ) is designed to mirror the performance of the S&P/ASX 200 index. It manages assets of over $4.4 billion and offers broad exposure to the top 200 listed companies in Australia [1].
In this review, we’ll take a closer look at the IOZ ETF, assessing its performance and how it compares to the index it tracks.
What is the IOZ ETF?
The IOZ ETF offers a budget-friendly investment opportunity with an annual management fee as low as 0.05%. It functions as an exchange-traded fund that tracks the S&P ASX 200 index.
This index is composed of the 200 largest Australian companies, chosen based on their market capitalization. It includes a wide variety of ASX-listed shares, encompassing sectors like banking, mining, retail, and healthcare.
IOZ ETF Chart & A200 ETF Share Price
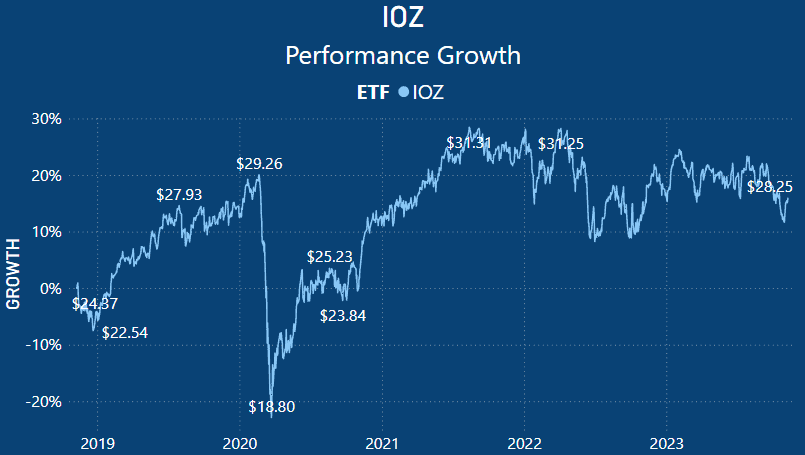 The IOZ share price has experienced a significant increase over the past five years. Starting in late 2018, the share price saw a decline heading into 2019. In 2019, the ETF price showed substantial growth, reaching a peak of around $29.26 in early 2020.
The sharp drop in the ETF share price can be attributed to the Covid-19 pandemic, where the price hit a low point at around $18.80 per ETF. Throughout 2020, it made a modest recovery but only partially regained ground from where it started that year.
In 2021, the IOZ ETF share price exhibited substantial growth, driven by robust performance, thanks to record-low interest rates and strong consumer confidence.
However, this positive trend and consumer confidence have not extended into 2022 and 2023. With increasing levels of consumer debt due to record-low interest rates, rising inflation, and global conflicts, the IOZ ETF price and performance have largely remained stagnant.
IOZ ETF Share Performance
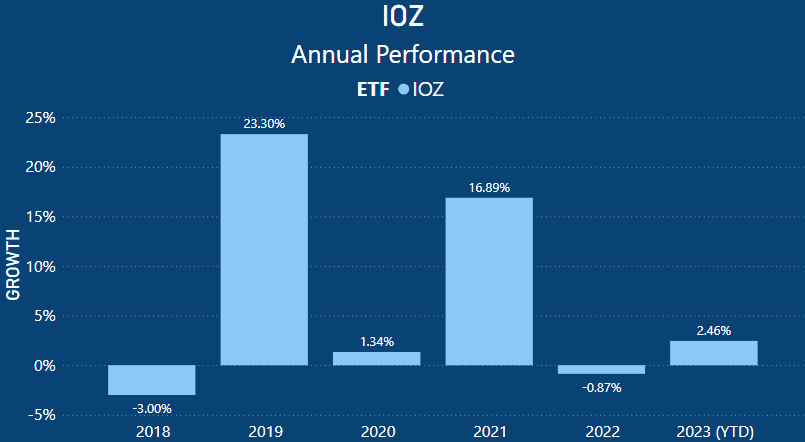
When analyzing the annualized return of the IOZ ETF, you can clearly see that the growth chart performance is much easier to comprehend than the boom and bust years.
In 2018, the year ended with an overall decrease of 3.00%, while 2019 recorded substantial gains at 23.30%. The emergence of Covid in the world and Australia in 2020 resulted in a meager performance return of 1.34%.
All things considered, investors can find solace in this performance, especially given the sharp decline in the ETF price.
Moving into 2021, the IOZ ETF had a stellar year, delivering a return of 16.89%. However, it has been followed by some lackluster performances since. In 2022, the IOZ ETF actually declined by -0.87%, and in 2023 year-to-date (YTD), IOZ has a performance return of 2.46%.
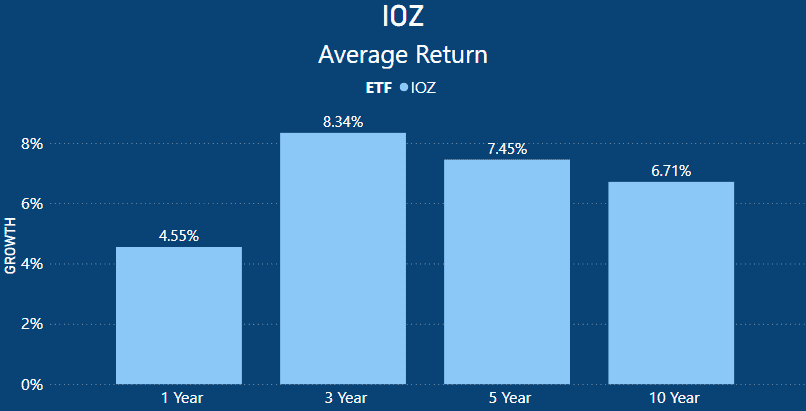
When examining IOZ’s average returns, we can observe that the 1 year average return stands at 4.55%. This is primarily attributed to the comparatively lackluster performances in both 2022 and 2023.
The 1 year average return is marginally higher than the S&P/ASX 200 index’s total return of 4.35% [2].
Expanding the horizon to a 3 year timeframe, the average return amounts to 8.34%. This surpasses the S&P/ASX 200’s annualized total return of 7.50%. The IOZ ETF outperformed the index by 0.84% [2].
Over a 5 year period, the IOZ ETF boasted an average return of 7.45%. This commendable return was marginally higher by 0.01% compared to that of the index.
For the 10 year span, IOZ achieved a return of 6.71%, which is 0.19% less than the S&P/ASX 200’s annualized total return of 6.90% [2].
IOZ ETF Dividend
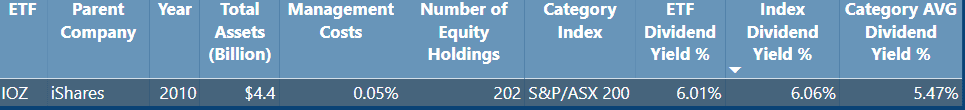
The IOZ has a dividend yield of 6.01%, which is paid on a semi-annual basis. The dividend distribution paid out on 19/10/2023 was 46.05 cents per ETF. This was slightly lower than the index average, which returned 6.06%.
However, IOZ had a higher dividend yield percentage than that of the category average. The category average was 5.47%, which was 0.54% less than that of the IOZ ETF’s dividend yield.
IOZ ETF Holdings
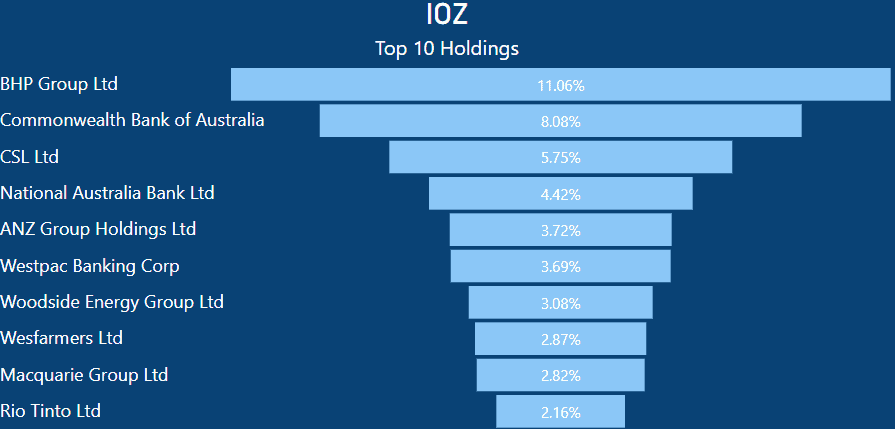
IOZ holds significant positions in some of Australia’s largest publicly traded companies. As is typical with ASX tracking ETFs, BHP and CBA often occupy the top two spots.
IOZ allocates 11.06% of its holdings to BHP Group and an additional 8.08% to CBA. These two companies alone constitute 19.14% of the entire ETF.
This means that if you had $10,000 invested in the IOZ ETF, you would own $1,106.00 worth of BHP shares and $808.00 in CBA shares.
Interestingly, among the top 10 holdings of IOZ, 5 are banks, and 3 are engaged in mining.
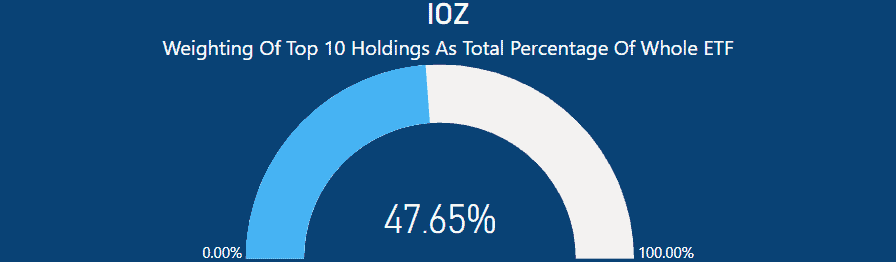
Furthermore, when you examine the top 10 holdings as a total percentage of the ETF, these holdings collectively make up 47.65%. Since IOZ tracks the S&P/ASX 200, it currently includes 202 equities. This means that just 10 companies account for nearly half of the ETF.
This is a common characteristic in the ASX 200 ETF landscape, as many competitors have similar or identical holdings. The primary difference lies in the weighting within the portfolio itself.
This was observed in my VAS ETF Review, which tracks the largest 300 companies on the ASX.
What we can ascertain from the current IOZ holdings is that nearly 50% of the overall performance is influenced by these 10 holdings, with 5 of them being banks and 3 in the mining sector.
Consequently, the ETF’s underlying performance is significantly affected by the performance of these individual companies.
Summary – Is IOZ ETF A Good Investment
The IOZ ETF represents a reliable investment choice, thanks to its consistent historical performance and strong correlation with the S&P/ASX 200 index it aims to track.
When considering ETFs that mirror an index, the primary aim is to benefit from its broad diversification.
This ETF is unlikely to significantly underperform or outperform the index, making it a safer option for investors. It closely mirrors the overall index, reducing risks associated with individual stock selection.
Overall, IOZ has delivered commendable returns during periods of overall ASX growth. Like all ASX ETFs, the performance of this ETF is strongly influenced by its top 10 holdings, with the banking and mining sectors exerting significant influence on the overall performance.
- https://www.blackrock.com/au/individual/products/251852/ishares-core-s-and-p-asx-200-etf
- https://www.spglobal.com/spdji/en/indices/equity/sp-asx-200/#overview
This article does not serve as an endorsement or recommendation for products mentioned in the article. The information presented here is based on referenced sources and is accurate as of the date of November 9, 2023. Please note that these articles are written sometime before their publication date.
The information provided in this content is for informational purposes only and should not be considered as financial, investment, or professional advice. We recommend consulting with a qualified expert or conducting your own research before making any financial decisions.
The accuracy, completeness, or reliability of the information cannot be guaranteed, and the provider shall not be held responsible for any actions taken based on the information contained in this content.