
DHHF vs VDHG: The All-in-One ETFs for Hands-off Investors
Last Updated on 20 February 2024 by Ryan Oldnall
Investors seeking a diversified ETF that covers all bases, are likely considering Vanguard Diversified High Growth Index ETF (ASX: VDHG).
VDHG is Vanguard’s solution for investors seeking a simple, diversified ETF with growth and fixed-income potential.
On the other hand, you have Betashares Diversified All Growth ETF (ASX: DHHF), Betashares’ near equivalent. Like VDHG, DHHF is a diversified ETF that invests in similar markets to VDHG but lacks the fixed income allocation.
In this article, we will compare DHHF vs VDHG to see how they stack up against each other.
Our analysis will provide a comprehensive overview of both ETFs, helping you determine which one better aligns with your investment objectives.
Betashares Diversified All Growth ETF (ASX: DHHF) Review
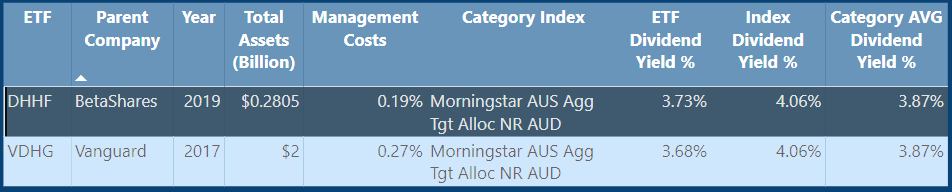
The Betashares Diversified All Growth ETF (ASX: DHHF) is, as the name implies, BetaShares’ one-stop shop for a growth ETF. DHHF offers diversified exposure with around 8,000 equities and a 100% investment in growth assets [1].
This ETF by BetaShares is known for its cost-effectiveness, investing in various markets at a relatively low fee. Its primary objective is to deliver diversified performance across numerous markets, with a core exposure to the Australian ASX 200 through through its investment in BetaShares, A200.
DHHF benefits from its Australian domicile, which reduces paperwork given its investments in multiple countries. DHHF’s assets under management are relatively small, standing at only $280.5 million having only launched in 2019.
BetaShares, established in 2009, has an impressive track record with over 900,000 current investors and manages a substantial $28 billion in Assets under Management (AUM) [2]. The company has cemented its position as a leading player in the Australian ETF market.
Vanguard Diversified High Growth Index ETF (VDHG) Review
The Vanguard Diversified High Growth Index ETF (VDHG) is Vanguard’s Australian High Growth Index ETF. It invests approximately 90% in growth assets and 10% in fixed income, including Australian fixed interests and international bonds [3].
This ETF invests in over 16,000 securities and, like DHHF, is domiciled in Australia.
Vanguard has had a presence in Australia since 1996 and introduced VDHG in 2017. VDHG manages 2 billion in assets under management, and Vanguard oversees a significant total of over A$10 trillion in assets worldwide [4],[5].
Vanguard’s commitment to the Australian market is evident through its recent launch of a super fund in October 2022, which I extensively reviewed in my Vanguard Super Review.
ETF Management Fees
ETF management fees are the yearly costs tied to investing in an ETF, covering responsibilities like overseeing and promoting the ETF.
These fees typically represent a modest portion of your investment, affecting your overall returns. It’s wise to choose ETFs with lower fees, as this allows you to keep a greater share of your earnings.
ETFs are often favored for their cost-effectiveness compared to other investment options. It’s essential to review an ETF’s Product Disclosure Statement (PDS) to understand the fee structure.
When considering DHHF and VDHG, they provide reasonable value in terms of fees, given the level of exposure they offer in their respective ETFs.
DHHF’s management fee currently sits at 0.19% per year. This means that with a $10,000 investment in the DHHF ETF, you’d only incur $19 in fees.
In contrast, VDHG has slightly higher fees at 0.27%. This translates to a $27 fee for a $10,000 investment in VDHG ETFs.
DHHF vs VDHG – Performance Comparison
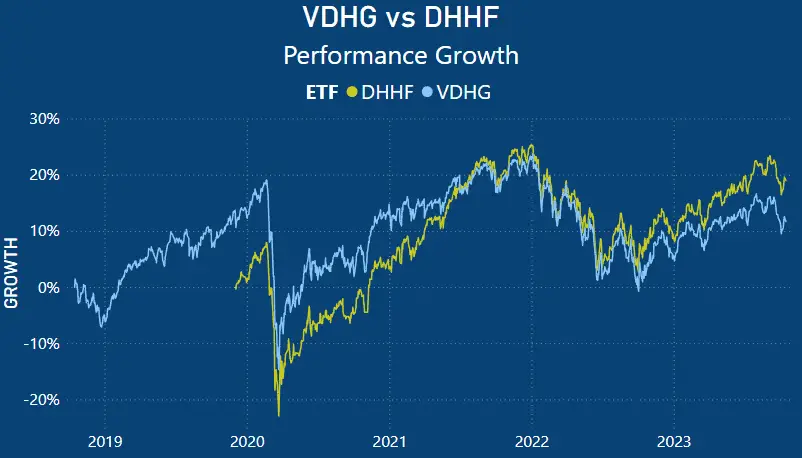
Analyzing a traditional stock market line chart, it becomes evident that the performances of DHHF and VDHG are relatively similar. This similarity is particularly noticeable during the period of 2022, with both experiencing comparable losses and gains.
Both ETFs faced a substantial decline in the early part of 2020, but they managed to recover throughout 2021. However, as we move into the latter part of 2022, DHHF appears to outperform VDHG, and these gains have been sustained into 2023.
VDHG vs DHHF – Annual Performance Comparison
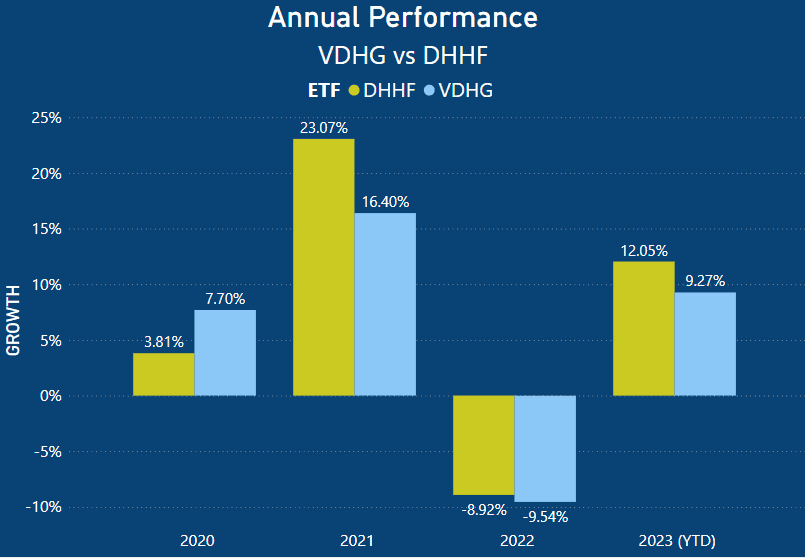
When we analyze the annual results starting from 2020, it becomes evident that the performance has seen significant fluctuations from year to year. In 2019, VDHG outperformed DHHF by a notable 3.89%, achieving a return of 7.70%.
However, in 2021, DHHF surpassed VDHG with a performance of 23.07%, compared to VDHG’s 16.40%.
In 2022, both VDHG and DHHF experienced declines, with losses of 9.54% and 8.92%, respectively. These losses can be attributed to factors such as rising inflation, increased global recession risks, and the Ukraine invasion.
In 2023, both DHHF and VDHG have demonstrated more resilience, with year-to-date performance returns of 12.06% and 9.27%, respectively. Once again, over the past three years, DHHF has outperformed VDHG.
VDHG vs DHHF – Average 3 Year Performance Comparison
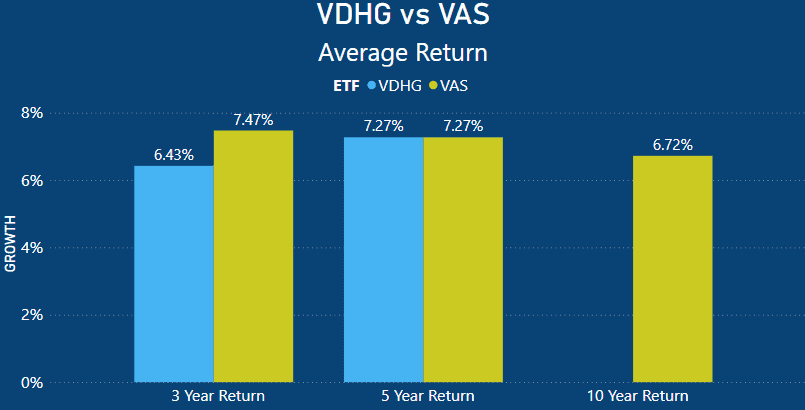
Looking specifically at the 3-year returns of VDHG and DHHF, it’s clear that DHHF has delivered stronger performance. Over the past 3 years, DHHF has maintained an average return of 9.41%, which is 2.17% higher than VDHG’s 7.24%.
According to Morningstar’s growth performance charts, if you had invested $10,000 in DHHF when it started on December 15, 2020, your initial investment would now be valued at $12,891 [6].
Similarly, using Morningstar’s performance charts, if you had invested $10,000 in VDHG when it began on November 20, 2017, your investment would currently be worth $15,018 [7].
ETF Holdings
ETFs are comprised of a collection of individual stocks that make up the underlying assets of the ETF. The ETF’s composition is primarily determined by the index it follows, its investment objectives, and sometimes specific criteria like ESG considerations.
In many cases, certain stocks within an ETF have larger holdings compared to others. This is applicable to both A200 and VAS. Despite these ETFs containing hundreds of stocks, a significant portion of their investments is concentrated in a select few.
However, some ETFs take an equal-weighting approach, where all the underlying stocks within the ETF are assigned the same weight. This means that in the event of one stock performing well while others underperform, a process known as “rebalancing” takes place to maintain equal weighting.
An example of such an Australian ETF is Vaneck’s MVW. I delve into this topic in more detail in my review of MVW vs VAS – What Is The Best Australian ETF?
DHHF Holdings
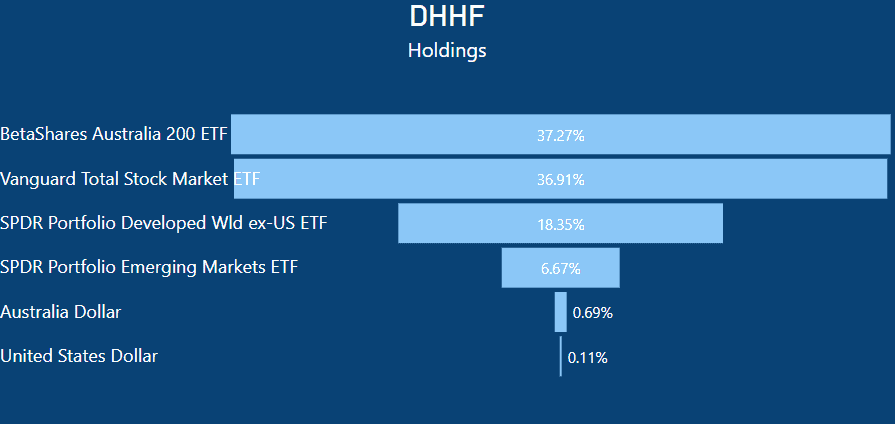
DHHF possesses a rather unique composition when compared to other ETFs in the market. Notably, DHHF allocates 37.27% of its investments to Betashares Australia 200 ETF (ASX:A200) and 36.91% to Vanguard US Total Market Shares Index ETF (VTS), the latter being listed on the US stock exchange.
Furthermore, DHHF dedicates 18.35% of its holdings to SPDR Portfolio Developed World ex-US ETF (SPDW).
As the name suggests, this ETF focuses on investments in the developed world while deliberately excluding the United States. This concept is similar to VGS, which invests in the MSCI world index but specifically excludes Australia.
In addition, DHHF allocates 6.67% of its assets to SPDR Portfolio Emerging Markets ETF (SPEM). Emerging countries in this ETF include Brazil, Chile, China, Colombia, Mexico, Peru, and other nations.
VDHG Holdings
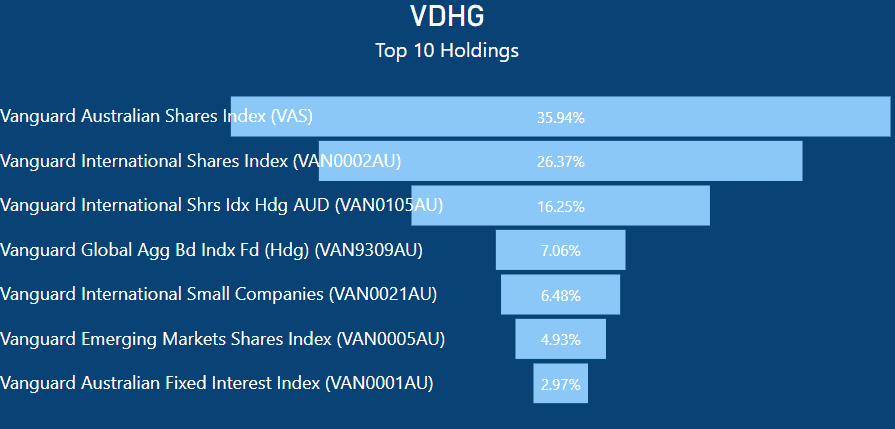
Similar to DHHF, VDHG primarily consists of index funds and an ETF. VDHG’s most substantial allocation is to VAS, accounting for 35.94% of its holdings. VAS tracks the ASX 300, which includes the 300 largest companies in Australia.
VDHG’s other allocations encompass international shares index at 26.73% and a hedged version at 16.25%.
In the context of international shares index investments, hedging is a strategy employed to mitigate the impact of currency exchange rate fluctuations on investment returns.
VDHG also allocates 6.48% to small-cap companies and 4.93% to emerging markets. Where VDHG diverges from DHHF is in its fixed income allocations.
VDHG designates 7.06% to hedged index bonds and 2.97% to Australian fixed interest.
DHHF vs VDHG – Asset Class Allocation
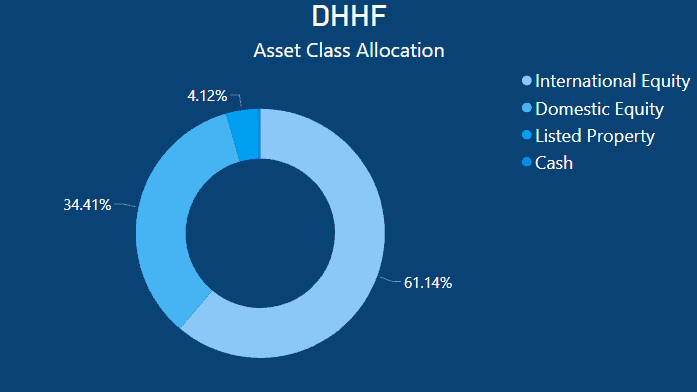
Considering the asset allocation, DHHF directs its investments toward international equities, domestic equities, listed properties, and cash. The majority of this allocation, 61.14%, is invested in international equities.
Domestic equities represent 34.41% of the allocation, listed properties constitute 4.12%, and the remaining portion is held in cash.
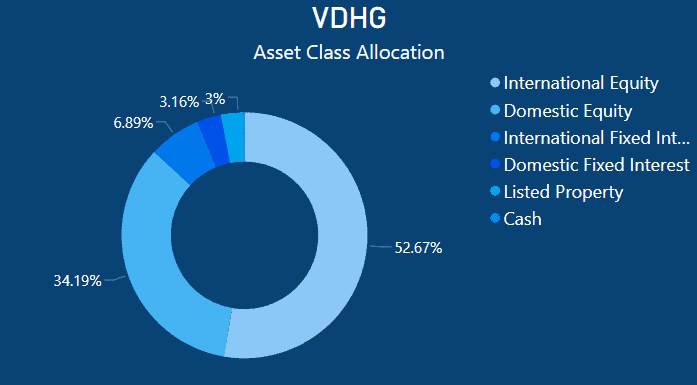
In a comparison with VDHG, it becomes apparent that VDHG maintains a smaller international investment, accounting for 52.67% of its allocation, which is 8.47% less than DHHF.
In the case of domestic equities, VDHG closely mirrors DHHF, with an allocation of 34.19%.
The significant differences in VDHG’s allocation are found in its ‘international fixed interest’ and ‘domestic fixed interest.’
International fixed interest represents 6.89%, while domestic fixed interes’ is 3.16% of the total allocation, neither of which is included in DHHF’s portfolio.
VDHG designates 3% to listed property, which is 1.12% less than DHHF, with the remainder held in cash, mirroring DHHF’s allocation.
Summary – DHHF 100% Growth or VDHG with it’s Growth and Income Potential?
When seeking an ETF that offers robust diversification, both VDHG and DHHF present compelling choices.
Their uniqueness lies in investing in other ETFs and index funds, delivering cost-effective avenues for substantial diversification and international exposure. Moreover, the fact that both are domiciled in Australia adds an extra bonus.
However, the suitability of these options depends on the kind of investor you are. DHHF, with its exclusive focus on 100% growth, caters to those less concerned with generating income from bonds or fixed interest.
Conversely, VDHG allocates 90% to growth and 10% to income-generating assets, making it suitable for those desiring a slight income component while still reaping the rewards of broader stock market growth.
One drawback I observe in both ETFs is their overall growth. When compared to other head-to-head comparisons I’ve done, such as IOO vs VGS, IOO vs IVV, and IVV vs VGS, you can see the difference in overall growth.
For instance, VGS boasts a year-to-date return of 19.85%, IVV at 15.38%, and IOO at 18.00%. In comparison DHHF and VDHG have returns of 12.06% and 9.27%, respectively.
The disparity in returns can largely be attributed to the composition of both VDHG and DHHF. They hold significant investments across a mix of emerging, developed, small-caps, bonds, and fixed interest markets.
On the other hand, all three – IVV, IOO, and VGS – have either 100% or approximately 70% concentration in the US stock market, which has experienced substantial growth in 2023.
Nonetheless, both VDHG and DHHF offer convenient “set and forget” ETF investment options. They deliver genuine diversification across the world, avoiding over-reliance on a single country.
-
- https://www.betashares.com.au/fund/diversified-all-growth-etf/
- https://www.betashares.com.au/about-us/
- https://www.vanguard.com.au/personal/invest-with-us/etf?portId=8221
- https://www.vanguard.com.au/personal/invest-with-us/etf?portId=8205
- https://www.vanguard.com.au/corporate/
- https://www.morningstar.com.au/investments/security/ASX/DHHF/performance
- https://www.morningstar.com.au/investments/security/ASX/VDHG/performance
This article does not serve as an endorsement or recommendation for products mentioned in the article. The information presented here is based on referenced sources and is accurate as of the date of October 16, 2023. Please note that these articles are written sometime before their publication date.
The information provided in this content is for informational purposes only and should not be considered as financial, investment, or professional advice. We recommend consulting with a qualified expert or conducting your own research before making any financial decisions.
The accuracy, completeness, or reliability of the information cannot be guaranteed, and the provider shall not be held responsible for any actions taken based on the information contained in this content.