Best Performing ETFs In Australia Over The Last 5 years
Last Updated on 20 February 2024 by Ryan Oldnall
Which ETFs have performed the best over the last 5 years? In this article we’ll breakdown Australia’s top best performing ETFs over the last 5 years, as well as, the best performing Small/ Mid Cap ETF, Asia ETF and reveal the best emerging markets ETFs
So let’s analyse the data and unveil the best-performing ETFs of the past 5 years using ASX ETF performance data which includes information up until the end of November 2023.
Best Performing ETFs In Australia Over The Last 5 years
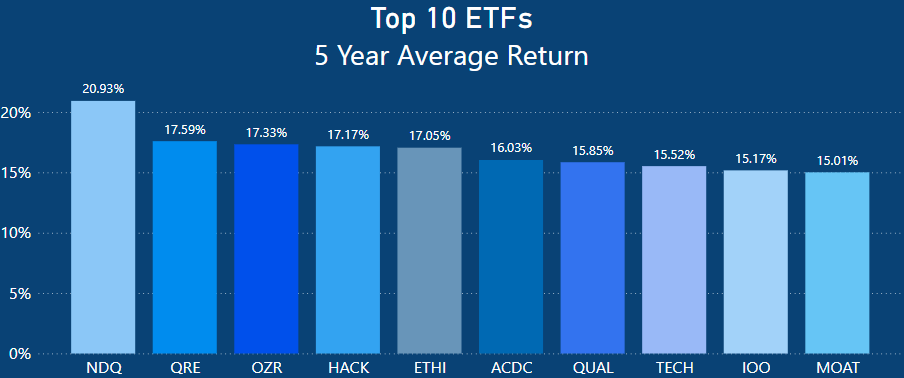
As we can observe from the performance chart above, Betashares NASDAQ 100 ETF, better known as NDQ, stands out as the best-performing ETF in Australia, boasting an average 5-year performance of 20.93%.
Following closely, the second-best performer is Betashares QRE, exhibiting an average 5-year return of 17.59%. This is closely trailed by SPDR’s own resource fund, OZR, with a 17.33% return.
As anticipated, the majority of the top 10 consists of global or international shares, as well as those in the tech industry.
Betashares Global Cybersecurity ETF, HACK, delivered a 5-year performance of 17.17%, closely followed by the only ASX-listed ETF in the top 10, BetaShares Global Sustainability Leaders ETF (ETHI), which impressively returned 17.05%.
Global X Battery Tech & Lithium ETF, also known as ACDC, returned 16.03%, navigating the various waves in the lithium and battery market. I have conducted a comprehensive review of the ACDC ETF so that you can decide if this investment aligns with your goals.
VanEck’s International Quality ETF returned 15.85%, followed closely by the Morningstar Global Technology ETF, TECH, with a 15.52% return.
Rounding out the top 10 is a favorite in many investor communities, iShares Global 100 ETF, recognized by its ticker symbol IOO, with a return of 15.17%. This is succeeded by the VanEck Morningstar Wide Moat ETF, MOAT, which secured a 15.01% return.
Interestingly, among the top 10 performing ETFs over the past 5 years on average, Betashares claims 4, while Global X holds 3. Notably, the ETF powerhouse Vanguard does not have any top-performing ETFs within the top 10.
Recap Best Performing ETFs In Australia Over The Last 5 Years
1. Betashares NASDAQ 100 ETF (NDQ):
-
- 5-Year Performance: 20.93%
- Expense Ratio: 0.48%
- FUM: $3,641.56 million
2. Betashares Resources Sector ETF (QRE):
-
- 5-Year Performance: 17.59%
- Expense Ratio: 0.34%
- FUM: $227.18 million
3. SPDR S&P/ASX 200 Resources Fund (OZR):
-
- 5-Year Performance: 17.33%
- Expense Ratio: 0.34%
- FUM: $177.35 million
4. Betashares Global Cybersecurity ETF (HACK):
-
- 5-Year Performance: 17.17%
- Expense Ratio: 0.67%
- FUM: $793.28 million
5. Betashares Global Sustainability Leaders ETF (ETHI):
-
- 5-Year Performance: 17.05%
- Expense Ratio: 0.59%
- FUM: $2,631.60 million
6. Global X Battery Tech & Lithium ETF (ACDC):
-
- 5-Year Performance: 16.03%
- Expense Ratio: 0.69%
- FUM: $550.60 million
7. VanEck MSCI International Quality ETF (QUAL):
-
- 5-Year Performance: 15.85%
- Expense Ratio: 0.40%
- FUM: $4,177.02 million
8. Global X Morningstar Global Technology ETF (TECH):
-
- 5-Year Performance: 15.52%
- Expense Ratio: 0.45%
- FUM: $319.60 million
9. iShares Global 100 ETF (IOO):
-
- 5-Year Performance: 15.17%
- Expense Ratio: 0.40%
- FUM: $2,923.33 million
10. VanEck Morningstar Wide Moat ETF (MOAT):
-
- 5-Year Performance: 15.01%
- Expense Ratio: 0.49%
- FUM: $722.54 million
Best Performing Small/ Mid Cap ETFs In Australia Over The Last 5 Years
What Are Small/ Mid Cap Companies?
Australian small and mid-cap companies, as categorized in the stock market context, are defined based on their market capitalization, representing the total value of a company’s outstanding shares.
Small-cap companies generally fall below a specified threshold, often ranging from $300 million to $2 billion, while mid-cap companies occupy an intermediate position, larger than small-caps but smaller than large-caps, often with market capitalizations between $2 billion and $10 billion.
These categorizations are fluid and can vary, considering factors such as revenue, total assets, and industry-specific norms.
Small and mid-cap companies are typically associated with higher risk but may offer greater growth potential, and they are often tracked by specific indices, such as the S&P/ASX Midcap 50 Index in Australia.
Investors should be aware that definitions may differ based on the criteria used by specific indices, funds, or financial professionals.
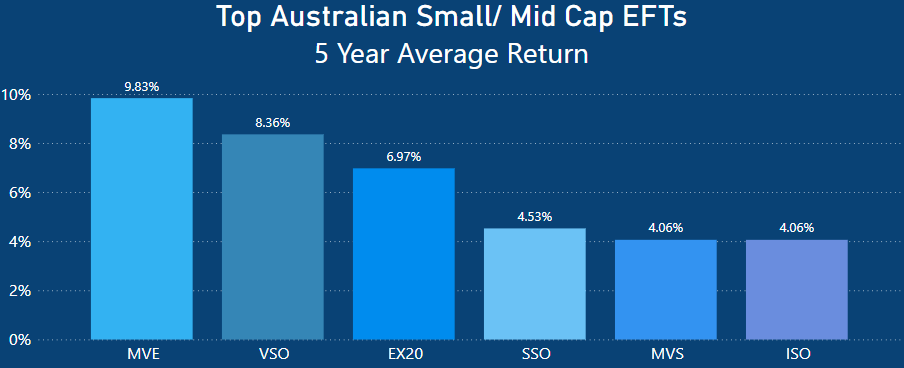
The best small/mid-cap ETF in Australia over the past 5 years belongs to VanEck S&P/ASX MidCap ETF (MVE) with an average 9.83% return. This performance was 1.47% better than the second-place Vanguard MSCI Australian Small Companies Index ETF (VSO), which returned 8.36%.
Securing the third position is the Betashares Australian Ex-20 Portfolio Diversifier ETF, designed to mirror the performance of an index (pre-fees and expenses).
This index consists of the 180 most significant stocks on the ASX, deliberately excluding the top 20 based on their market capitalization. EX20 delivered an impressive return of 6.97%.
SPDR S&P/ASX Small Ordinaries Fund (SSO) returned 4.53%, with VanEck Small Companies Masters ETF (MVS) returning 4.06%. Lastly, iShares S&P/ASX Small Ordinaries ETF, ISO returned 4.06%, which was the lowest among the small/mid-cap ETFs.
Recap Of Best Performing Small/ Mid Cap ETFs In Australia Over The Last 5 Years
1. VanEck S&P/ASX MidCap ETF (MVE):
-
- 5-Year Performance: 9.83%
- Expense Ratio: 0.45%
- FUM: $178.38 million
2. Vanguard MSCI Australian Small Companies Index ETF (VSO):
-
- 5-Year Performance: 8.36%
- Expense Ratio: 0.30%
- FUM: $798.91 million
3. Betashares Australian Ex-20 Portfolio Diversifier ETF (EX20):
-
- 5-Year Performance: 6.97%
- Expense Ratio: 0.25%
- FUM: $234.48 million
4. SPDR S&P/ASX Small Ordinaries Fund (SSO):
-
- 5-Year Performance: 4.53%
- Expense Ratio: 0.50%
- FUM: $24.70 million
5. VanEck Small Companies Masters ETF (MVS):
-
- 5-Year Performance: 4.06%
- Expense Ratio: 0.49%
- FUM: $46.24 million
6. iShares S&P/ASX Small Ordinaries ETF (ISO):
-
- 5-Year Performance: 4.06%
- Expense Ratio: 0.55%
- FUM: $124.95 million
Best Performing Asian ETFs In Australia Over The Last 5 Years
What Are Asian ETFs?
Asian investor ETFs are exchange-traded funds tailored for investors in the Asian region, designed to track a diversified basket of stocks or securities within the Asian market.
They offer options, including broad-based funds covering the entire Asian region and targeted funds focusing on specific countries like China or Taiwan.
These ETFs aim to align with Asian investment preferences, strategically selecting assets based on an outlined investment strategy.
This provides investors with a cost-effective and accessible means to invest in a well-rounded portfolio reflecting their specific objectives in the dynamic Asian market.
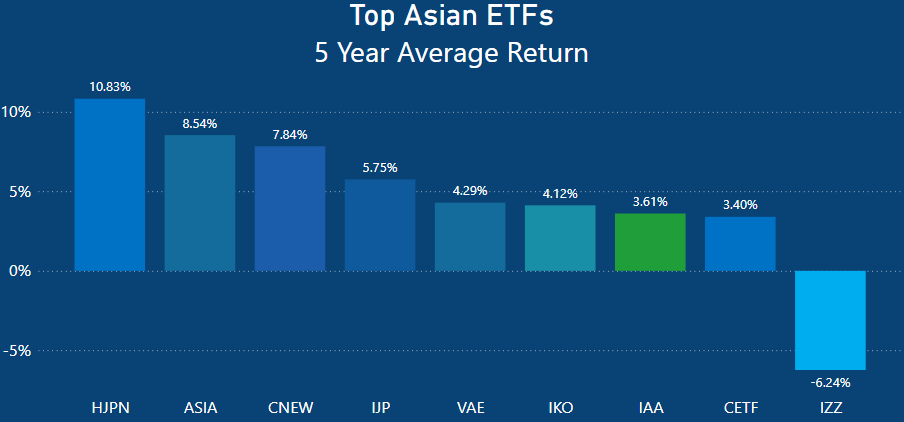
The standout performer in the Asian ETF market is Betashares Japan ETF – Currency Hedged (HJPN) with a return of 10.83%. This outperformed the other hugely popular and well-known Betashares ETF, ASIA. The Betashares Asia Technology Tigers ETF returned a 5-year average of 8.54%, which was 2.29% less than that of HJPN.
In third place is VanEck China New Economy ETF (CNEW), which returned 7.84%. This ETF focuses on prosperous Chinese companies in healthcare, technology, consumer staples, and consumer discretionary. CNEW fared a lot better than other Chinese-focused ETFs.
iShares MSCI Japan ETF (IJP) returned 5.75%, which is just under half of that of Betashares currency-hedged ETF, HJPN. Vanguard’s very popular VAE returned 4.29%. The Vanguard FTSE Asia Ex-Japan Shares Index ETF has been significantly outperformed by other Asia-focused ETFs.
iShares’ South Korea-led ETF, iShares MSCI South Korea ETF (IKO), returned 4.12%, while iShares Asia 50 ETF (IAA) returned a similar figure of 3.61%.
The worst performer by a significant margin was iShares China Large-Cap ETF (IZZ). IZZ returned a 5-year average of -6.24%. IZZ was trading at $37.85 an ETF at the end of November, having started the year out at $55.12.
Recap Of Best Performing Asian ETFs In Australia Over The Last 5 Years
1. Betashares Japan ETF – Currency Hedged (HJPN):
-
- 5-Year Performance: 10.83%
- Expense Ratio: 0.56%
- FUM: $94.29 million
2. Betashares Asia Technology Tigers ETF (ASIA):
-
- 5-Year Performance: 8.54%
- Expense Ratio: 0.67%
- FUM: $456.75 million
3. VanEck China New Economy ETF (CNEW):
-
- 5-Year Performance: 7.84%
- Expense Ratio: 0.95%
- FUM: $113.87 million
4. iShares MSCI Japan ETF (IJP):
-
- 5-Year Performance: 5.75%
- Expense Ratio: 0.50%
- FUM: $524.81 million
5. Vanguard FTSE Asia Ex-Japan Shares Index ETF (VAE):
-
- 5-Year Performance: 4.29%
- Expense Ratio: 0.40%
- FUM: $317.39 million
6. iShares MSCI South Korea ETF (IKO):
-
- 5-Year Performance: 4.12%
- Expense Ratio: 0.59%
- FUM: $181.75 million
7. iShares Asia 50 ETF (IAA):
-
- 5-Year Performance: 3.61%
- Expense Ratio: 0.51%
- FUM: $670.02 million
8. VanEck FTSE China A50 ETF (CETF):
-
- 5-Year Performance: 3.40%
- Expense Ratio: 0.60%
- FUM: $18.03 million
9. iShares China Large-Cap ETF (IZZ):
-
- 5-Year Performance: -6.24%
- Expense Ratio: 0.77%
- FUM: $281.42 million
Best Performing Emerging Markets In Australia Over The Last 5 Years
What Are Emerging Markets?
Emerging markets for investments refer to economies in the process of rapid development, often characterized by above-average growth rates, market reforms, and increased integration into the global economy.
These markets are typically in transition from developing to more advanced stages. Common features include high growth potential driven by factors like industrialization and urbanization, ongoing economic reforms to attract foreign investment, and a growing middle class.
Emerging markets often exhibit dynamic demographics with a youthful and expanding population, contributing to a potentially large and productive labor force. Financial and institutional changes, such as the development of stock markets and regulatory improvements, are also observed.
Examples historically include countries in Asia, Latin America, Africa, and Eastern Europe. Investors seek exposure to these markets for potential higher returns, but they also come with higher risk due to factors like political instability and currency volatility.
Top Emerging Markets In Australia Over The Last 5 Years
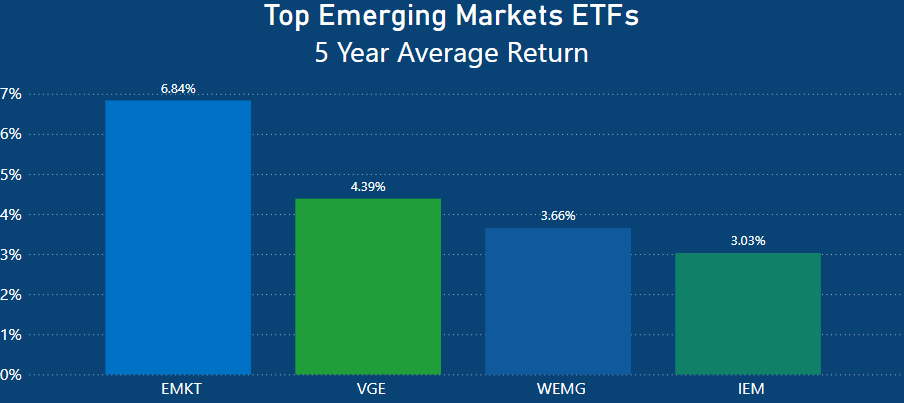
VanEck MSCI Multifactor Emerging Markets Equity (EMKT) emerges as the best performer of the past 5 years by a considerable margin, boasting a 6.84% return. This is followed by the better-known Vanguard product, VGE.
Vanguard FTSE Emerging Markets Shares ETF (VGE) returned 4.39%, which is 2.45% less than the return of EMKT. In third place is SPDR S&P Emerging Markets Carbon Control Fund (WEMG), which returned 3.66%.
Lastly, iShares MSCI Emerging Markets ETF (IEM) returned a 3.03% 5-year average. This means that EMKT had twice the average 5-year performance of IEM.
Recap Of Best Performing Emerging Markets In Australia Over The Last 5 Years
1. Vaneck MSCI Multifactor Emerging Markets Equity ETF (EMKT):
-
- 5-Year Performance: 6.84%
- Expense Ratio: 0.69%
- FUM: $71.60 million
2. Vanguard FTSE Emerging Markets Shares ETF (VGE):
-
- 5-Year Performance: 4.39%
- Expense Ratio: 0.48%
- FUM: $723.60 million
3. SPDR S&P Emerging Markets Carbon Control Fund (WEMG):
-
- 5-Year Performance: 3.66%
- Expense Ratio: 0.65%
- FUM: $18.40 million
4. iShares MSCI Emerging Markets ETF (IEM):
-
- 5-Year Performance: 3.03%
- Expense Ratio: 0.69%
- FUM: $892.44 million
Summary
It comes as little surprise that the Betashares NASDAQ 100 ETF (NDQ), which invests in 100 of the largest non-financial companies listed on the NASDAQ market, is the top performer over the past 5 years with a stellar average return of 20.93%, standing head and shoulders above the rest.
The likes of Apple, Tesla, Nvidia, META, Google, and the like have had astronomical performances in 2023, leading to stellar growth in the overall American stock market.
That being said, resource-driven Aussie ETFs such as the Betashares Australian Resources Sector ETF (QRE) and the SPDR S&P/ASX 200 Resources (OZR) had great returns of 17.59% and 17.33%, respectively.
This article does not serve as an endorsement or recommendation for products mentioned in the article. The information presented here is based on referenced sources and is accurate as of the date of December 29, 2023. Please note that these articles are written sometime before their publication date.
The information provided in this content is for informational purposes only and should not be considered as financial, investment, or professional advice. We recommend consulting with a qualified expert or conducting your own research before making any financial decisions.
The accuracy, completeness, or reliability of the information cannot be guaranteed, and the provider shall not be held responsible for any actions taken based on the information contained in this content.