
A200 vs VAS – Which To Choose?
Last Updated on 27 January 2024 by Ryan Oldnall
The Australian domestic market has demonstrated remarkable growth over the past decade, even in the face of challenges like the Covid-19 pandemic. Despite a significant decline in the early part of 2020, the annualized 10-year total return, as of today, stands at 7.93% [1].
In this article, we will conduct a performance comparison between two highly popular ETFs that mirror the Australian Domestic Market: A200 vs VAS
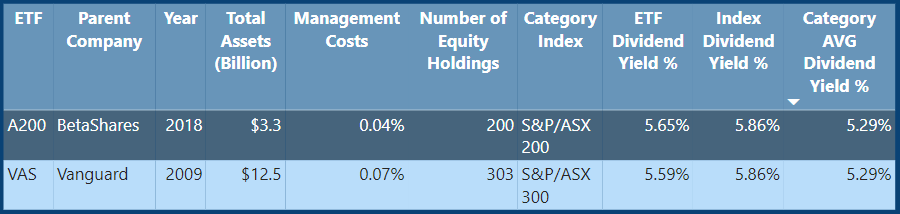
A subtle difference exists between BetaShares A200 and Vanguards VAS, as A200 tracks the top 200 stocks in Australia, while Vanguard covers the top 300.
Our analysis will provide a comprehensive overview of both ETFs, aiding you in determining which one aligns better with your investment objectives.
A200 BetaShares Review
The BetaShares A200 ETF is an Australian exchange-traded fund known for its cost-efficiency. It aims to replicate the performance of the S&P/ASX 200 index, which comprises the 200 largest companies listed on the Australian Stock Exchange (ASX).
ASX A200 was established in 2018 and is managed by its parent company, Betashares.
BetaShares, founded in 2009, boasts an impressive track record with over 900,000 investors to date and manages a substantial $28 billion in Assets under Management (AUM) [2]. The company has firmly established itself as a prominent leader in the Australian ETF market
VAS Review
Vanguard Australian Shares Index ETF, commonly known as VAS, holds the distinction of being Australia’s most popular ETF. VAS mirrors the performance of the S&P/ASX 300, representing the 300 largest companies listed on the ASX.
VAS made its debut in 2009, courtesy of Vanguard, a global investment management company that serves more than 50 million investors worldwide.
Vanguard has maintained a presence in Australia since 1996 and introduced the VAS ETF in 2009, managing a substantial total of over A$10 trillion in assets globally [3],[4].
Vanguard’s commitment to the Australian market remains evident through its recent introduction of a super fund in October 2022. I have since performed an extensive ,Vanguard Super Review.
ETF Management Fees
ETF management fees represent annual charges associated with investing in an ETF, encompassing tasks like overseeing and promoting the ETF.
These fees typically constitute a modest percentage of your investment, impacting your overall returns. Opting for ETFs with lower fees is advisable since it means a greater portion of your earnings remains in your possession.
ETFs are often favored for their cost-efficiency compared to other investment options. It’s crucial to review an ETF’s Product Disclosure Statement (PDS) to grasp the fee structure. In the case of A200 and VAS, they offer remarkably low management fees.
A200 Management fee was recently reduced from 0.07% to 0.04% annually, effective February 22, 2023. Consequently, with a $10,000 investment in A200 ETFs, you’d incur only $4 in fees.
Similarly, VAS lowered its management fee from 0.10% to 0.07%, effective July 3, 2023. This implies that for a $10,000 investment in VAS ETFs, you’d pay $7 in fees.
A200 Dividend History
The current A200 dividend yield (distribution) is 5.65%, which is slightly lower than the index’s dividend yield of 5.86%. This distribution is paid out on a quarterly basis.
VAS Dividend History
The present VAS dividend yield (distribution) stands at 5.59%, which fall below both A200 and the index’s dividend rates. Nevertheless, both A200 and VAS outperform the category average of 5.29% in terms of yield.
Similar to A200 ASX, VAS ASX also distributes its ETF dividends on a quarterly basis.
A200 vs VAS – 5 Year Performance Comparison
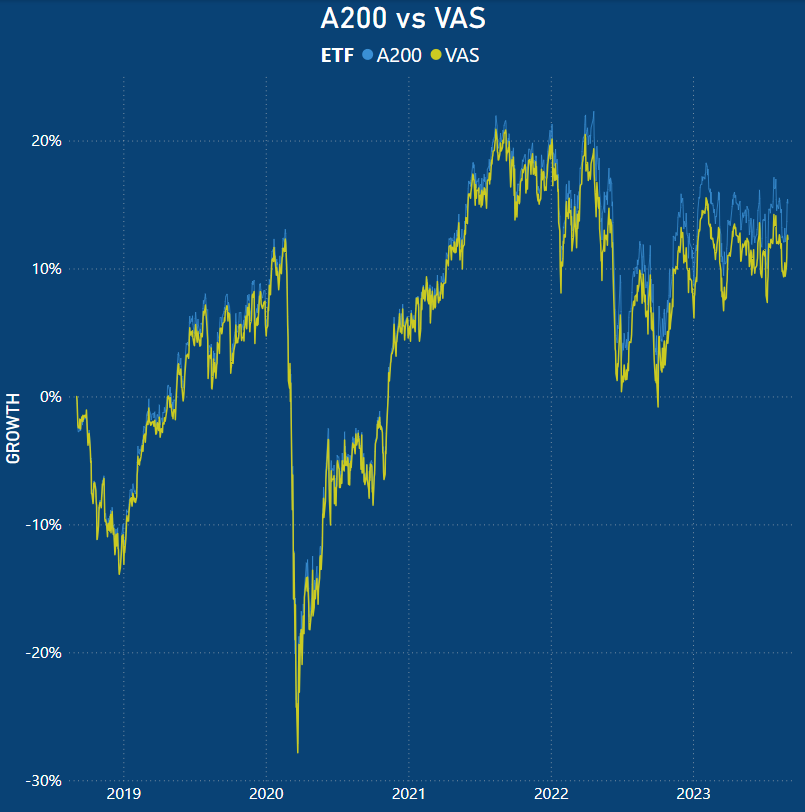
When looking at your classic stock market line chart we can see that the relative performances of both VAS and A200 are somewhat comparable. Both ETFs sustained a heavy decline in early 2020, before making that up through 2021.
The difference in performances has been marginal throughout the past 5 years despite A200 tracking the ASX 200 and VAS tracking the ASX300.
VAS vs A200 – Annual Performance Comparison
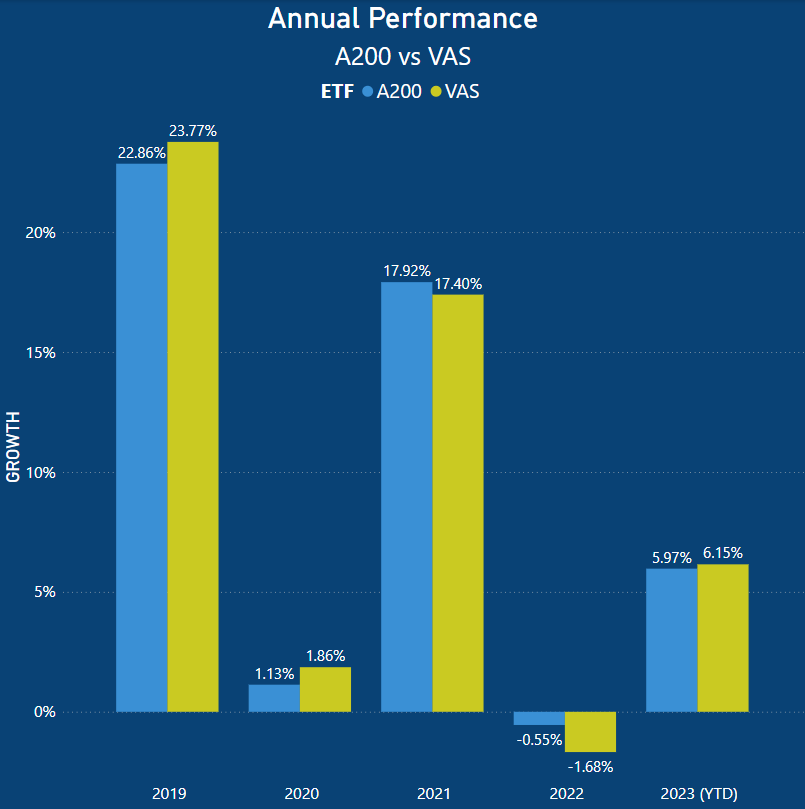
When examining the annual results from 2019 onwards, it becomes apparent that the performances have been quite comparable. In 2019, VAS exceeded A200 performance by 0.91%, and this trend continued in 2020 with a 0.73% out performance.
However, both the VAS performance and A200 return delivered less than 2% in 2020, primarily due to the impact of the COVID-19 pandemic on the global economy.
In 2021, as the market regained its footing, A200 outperformed VAS by 0.52%, but both investments faced a decline in performance in 2022.
In 2022, market conditions deteriorated due to rising inflation, heightened risks of a global recession, and the invasion Ukraine. This negative trend has persisted into 2023, with A200 showing a year-to-date growth of just 5.97%.
ETF Holdings
ETFs consist of a collection of individual stocks that make up the underlying assets of the ETF. The composition of an ETF is primarily determined by the index it tracks, its investment objectives, and, in some cases, specific screening and criteria, such as ESG considerations.
In many instances, an ETF will feature shares with larger holdings than others. This holds true for both A200 and VAS. Despite these ETFs containing hundreds of stocks, a significant portion of their investments is concentrated in a select few.
However, some ETFs adopt an equal-weighting approach, where all the underlying shares within the ETF carry the same weight. This means that when one stock performs well while others underperform, a process called “rebalancing” occurs to maintain equal weighting.
An example of such an Australian ETF is Vaneck’s MVW. I delve into this topic in greater detail in my review of MVW vs VAS – What Is The Best Australian ETF? The findings may surprise you.
A200 Holdings
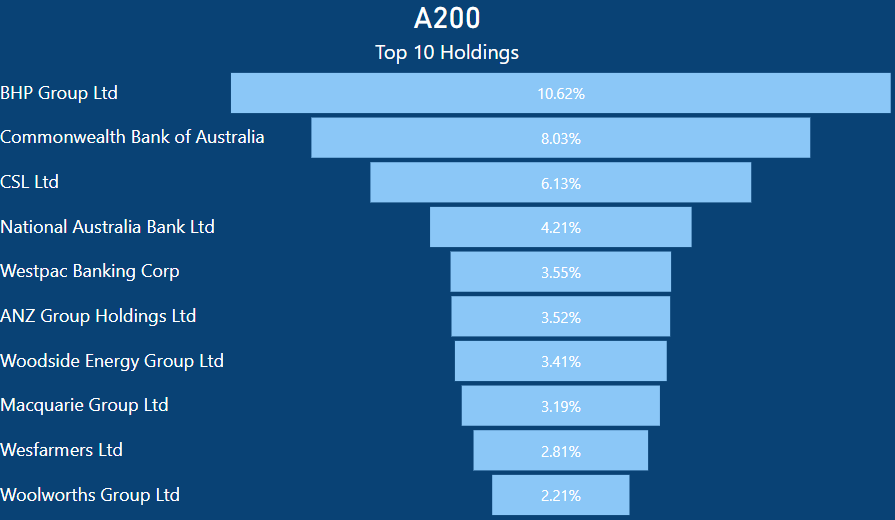
A200 has substantial investments in a select number of Australian companies, with the largest being BHP Group. Allocating 10.62% of its portfolio to BHP means that if you had $1,000 invested in A200, BHP would constitute $106.2 of that investment.
Given the significant market capitalization of Australian banks, it’s not surprising that they are prominently featured within A200’s ETF. Notably, A200’s top 10 holdings include no fewer than five banks.
VAS Holdings
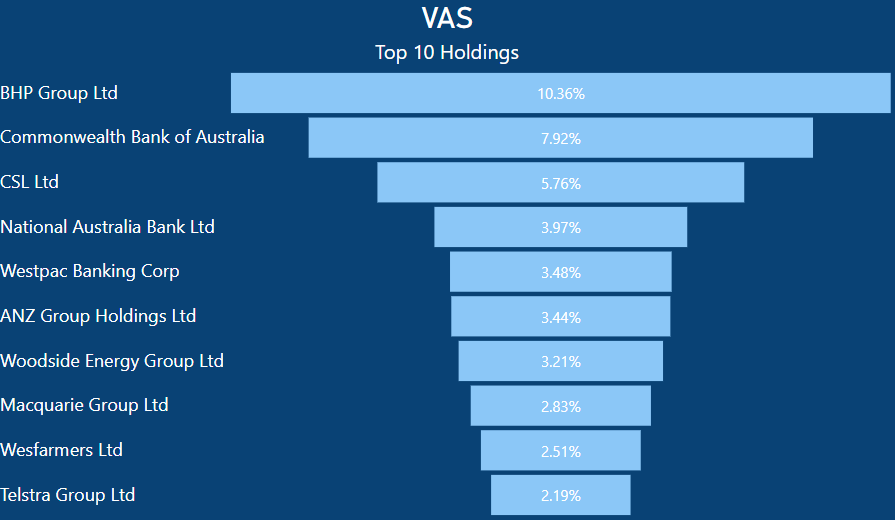
Like A200, VAS has a significant investment in BHP Group. For the same $1,000 invested in VAS, you would own $103.60 of BHP stock. BHP is a significant weighting largely due to its high-paying dividend, which is distributed through the ETF.
Both A200 and VAS also feature five banks within their ETF holdings. As previously discussed, Australian banks command substantial market capitalization, leading to their notable representation in these ETFs.
A comparison of the Top 10 ASX-listed banks by market cap underscores the considerable disparities among institutions, such as Commbank and Bank of Queensland.
Interestingly, Telstra Group is included in the VAS ETF. If you were to check the Telstra share price, it has done very little over time. At the time of writing, Telstra (TLS) has increased by 29.68% in the past 5 years.
Over the course of its existence (since 1999), Telstra has actually declined in value by 53.47%. So why include it?
The inclusion of Telstra in VAS can be attributed to its dividend yield. Telstra choose to distribute profits as dividends rather than reinvesting extensively for capital growth.
Consequently, the share price tends to exhibit limited growth compared to firms that reinvest profits more aggressively.
A200 vs VAS – Top 10 Holdings As Total Percentage of ETF
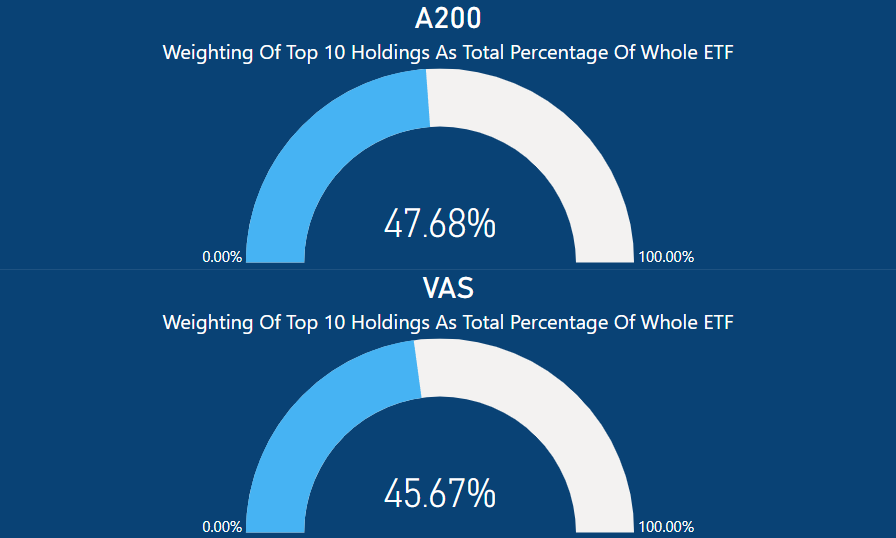
When examining the top 10 holdings and their overall weight within the ETF, it becomes evident that they constitute a substantial portion. In the case of the A200 ETF, these 10 shares account for a significant 47.68% of the total ETF.
As previously mentioned, A200 maintains precisely 200 equity holdings, leaving the remaining 190 equities to make up the remaining 52.32%.
Similarly, within the VAS ETF, the top 10 holdings contribute to 45.67% of the ETF’s composition. Since ASX VAS tracks the ASX 300, it encompasses a total of 303 equity holdings. This implies that the remaining 54.33% is distributed across 293 equities.
For instance, if each of the remaining equities had an equal share of the remaining percentage, they would each represent approximately 0.19% of the total. However, this is not the case, and it helps explain why both A200 and VAS exhibit similar performances.
With nearly half of the ETF’s composition driven by these very similar holdings, their overall performances closely align. Additionally, given VAS’s larger number of equity holdings, the impact of those additional 100 holdings is likely negligible.
A200 vs VAS – Market Cap Percentage
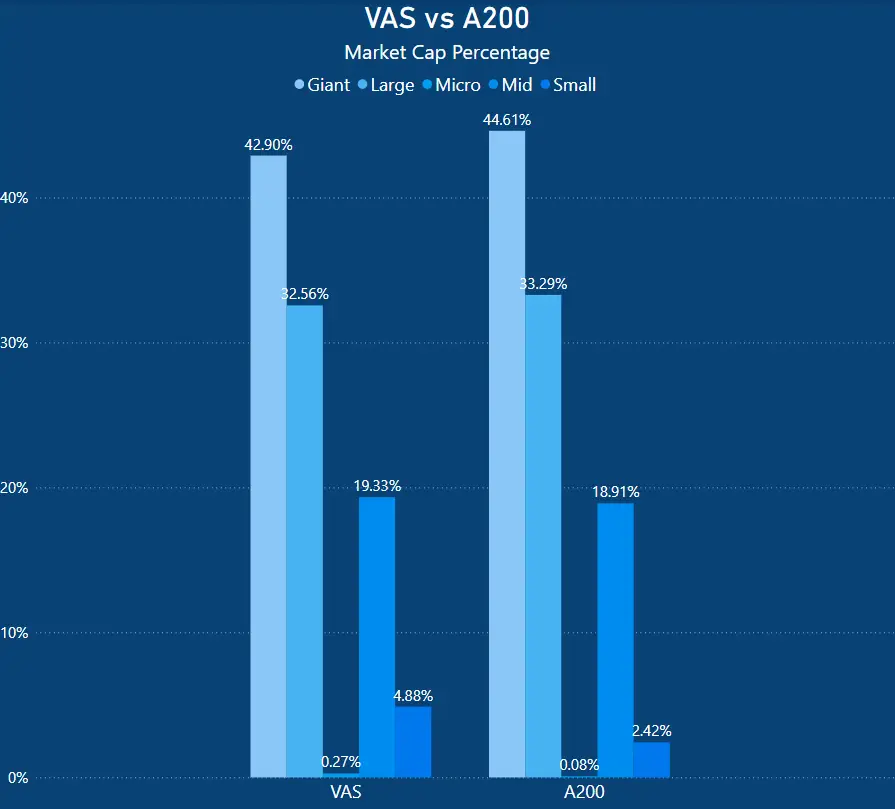
To sum up the discussion on holdings, it’s evident that both VAS and A200 have substantial investments in giant and large-cap companies. When you combine the totals, VAS accounts for 75.46%, while A200 comprises 77.90% in this category.
As a result, a significant portion of each ETF is dedicated to large, well-established companies known for their stability.
It’s improbable that either ETF would have substantial investments in the next Tesla, Apple, or Google, as these iconic companies began as small enterprises and grew over time.
In the context of these ETFs, such companies would represent a tiny fraction of the overall investment until they achieve a significant market presence and attract substantial investments.
VAS vs A200 – Asset Class Allocation
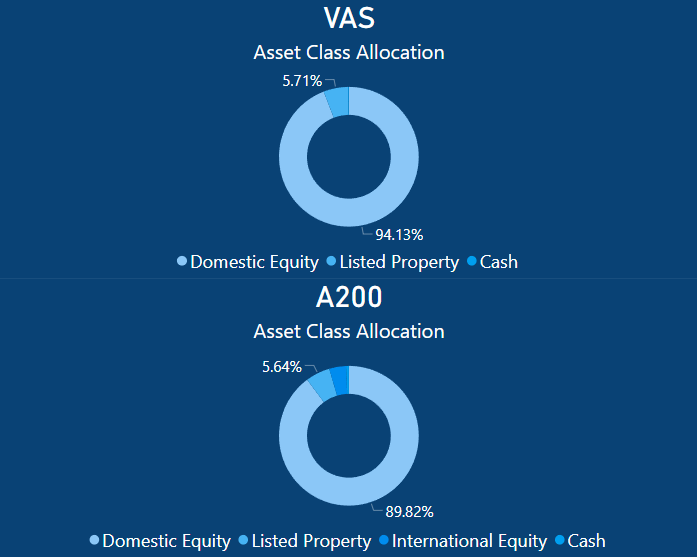
In terms of asset allocation, A200 allocates 89.82% of its portfolio to domestic equities, while listed properties make up 5.64%, international equity represents 3.9%, and the remaining portion is held in cash.
Similarly, VAS allocates 94.13% of its assets to domestic equity and designates 5.71% to listed property, with the rest in cash.
Summary – Which to Choose A200 vs VAS?
To sum up, when deciding between A200 or VAS they both present an attractive value proposition due to their low management fees, providing investors with a means to tap into the broad Australian equity market.
However, it’s crucial to recognize that both ETFs carry significant positions in some of Australia’s largest corporations.
Hence, it wouldn’t be practical to invest in both Vanguard VAS ETF and BetaShares’ A200 ETF simultaneously.
Owning both of these ETFs would result in BHP representing 20% of the overall holdings, undermining one of the core benefits that attract people to ETFs—diversification.