NDQ vs FANG: Which Tech ETF Is Right For You?
Last Updated on 30 March 2024 by Ryan Oldnall
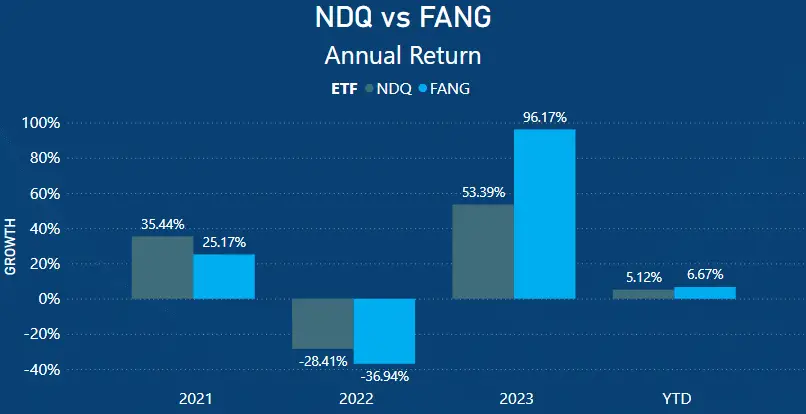
In 2023, American Tech companies, particularly those investing in artificial intelligence, saw remarkable market success. The BetaShares NASDAQ 100 ETF, NDQ alone gained a whopping 53.39%, while Global X FANG+ ETF, FANG surpassed it with a staggering 96.17% return [1].
This article offers a side-by-side comparison of NDQ and FANG using Yahoo Finance and Morningstar data [1][2]. Providing insights into their management fees, individual performance returns, Top 10 holdings, and market cap.
NDQ ETF Review
Pros
Cons
The Nasdaq 100 ETF, also known as NDQ, is a great option for investors looking to gain exposure to the growth of the NASDAQ 100 Index. NDQ’s objective is to mirror the performance of the index, which gives investors direct exposure to the movements of leading tech companies.
Comprised of 100 global non-financial companies listed on the Nasdaq exchange, the Nasdaq 100 has tech giants like Amazon, Microsoft, Apple, and Google (Alphabet) among its listings.
Since its inception on May 26, 2015, NDQ has consistently delivered robust performance on the ASX. In my analysis of Australia’s top-performing ETFs over the past 5 years, NDQ stood out as the best performer over that time frame.
BetaShares, the parent company of NDQ, was founded in 2009 and manages approximately 1 million investments, with assets totaling $35 billion. They offer a diverse range of 95 ETFs on the Australian ETF market [4].
FANG ETF Review
Pros
Cons
The Global X FANG+ ETF, commonly referred to as FANG, was introduced on February 27, 2020, under its parent company Global X. This ETF is designed to invest in companies leading the way in next-generation technology.
FANG aims to replicate the price and yield performance of the NYSE FANG+ Index before accounting for fees and expenses [5].
The name FANG, which is actually an abbreviation for some of its core underlying holdings, though doesn’t quite work out today due to a few name changes.
For instance, the ‘F‘ in FANG is Facebook, which has since changed its name to Meta. ‘A‘ is for Amazon, ‘N‘ is for everyone’s favorite streaming service, Netflix, and ‘G‘ is for, you guessed it, Google. Though for many investors, we know Google more so by their stock listing, Alphabet.
FANG is by far the most concentrated ETF I have reviewed, and that is many! FANG has just 10 holdings, which I’ll cover off down below. These holdings make up the entire ETF.
FANG‘s parent company Global X has locations in several countries around the globe with a presence in Europe, Asia, North and South America, and Australia. As of February 2024, Global X has ETF assets under management (AUM) to the tune of $53 billion USD [6].
With approximately $81 billion AUD in assets under management (AUM), Global X is twice the size of BetaShares, which holds around $35 billion.
NDQ vs FANG Management Expense Ratio (ETF Management Fees)
Management fees, or Management Expense Ratios (MERs), play an important role in assessing ETF investments. While ETFs aim to closely track their underlying indices, it’s essential to consider fees and expenses as they impact returns.
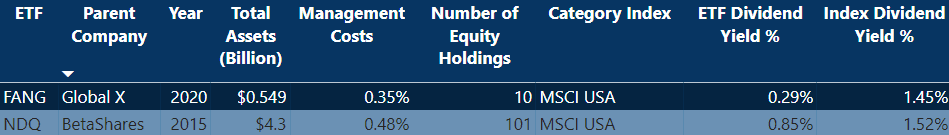
Comparing the management fees of NDQ and FANG, FANG emerges as the cheaper option, with a management expense ratio of 0.35%.
In contrast, NDQ carries a higher management expense ratio of 0.48%, which is 0.13% greater than FANG‘s.
Both FANG and NDQ indeed have slightly higher fees compared to other ASX-listed ETFs like iShares Core S&P 500 ETF (IVV), which boasts a management expense ratio (MER) of just 0.04%.
Despite the higher fees, many investors may find both FANG‘s and NDQ‘s performance over the past 3-5 years justifies their costs.
To provide perspective on the cost of these fees, for every $10,000 invested in NDQ you would incur a fee of $48, while FANG would cost $35.
In a separate article I covered Who Has The Lowest ETF Management Fees In Australia?, using ASX data.
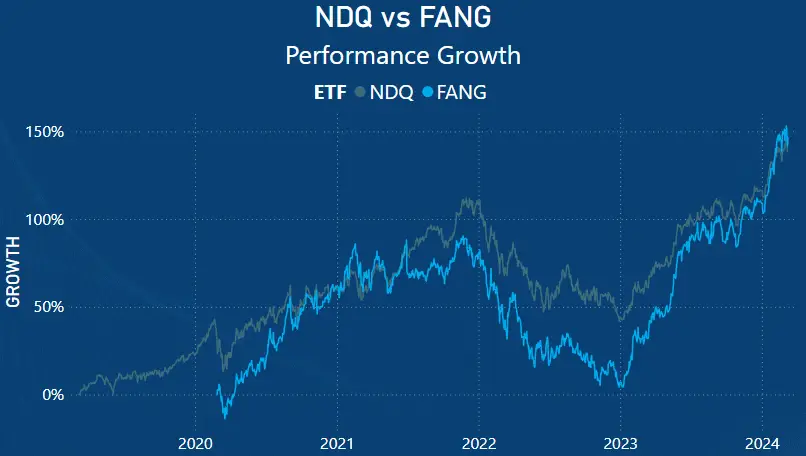
NDQ vs FANG – Performance Chart
NDQ vs FANG – Annualised Returns
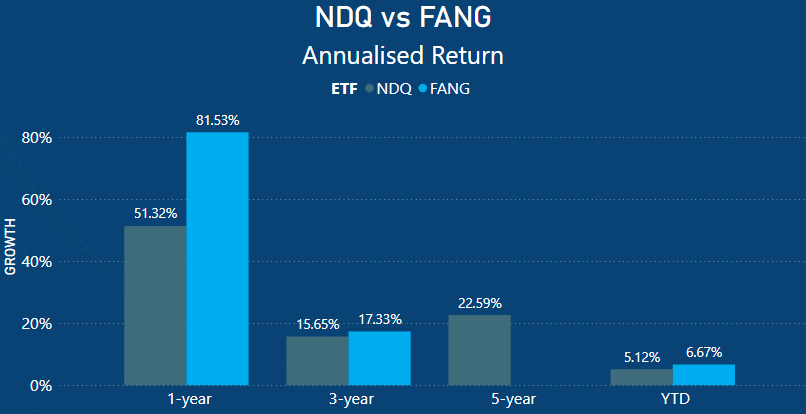
When looking at the side-by-side performance comparisons, it is important to note that FANG has a relatively short performance history, having only been established in February 2020, while NDQ was established in May of 2015.
When examining the Year-to-Date (YTD) performances, NDQ has returned 5.12%, with FANG starting stronger at 6.67%. This performance difference equates to 1.55%.
Over the short-term period of 1 year, NDQ returned 51.32% and FANG a staggering 81.53%. The performance difference here is phenomenal, with FANG delivering 30.21% more in the space of a year.
Looking at the 3-year mark, the annualized performance differences are somewhat comparable, with NDQ having delivered 15.65% and FANG 17.33%. This means that FANG still provided, on average, 1.68% better return each year over those 3 years.
Lastly, when examining a 5-year time frame, FANG, as expected, does not have any performance data. However, NDQ does, with a very decent 22.59% 5-year annualized return. Again, to put this into perspective, NDQ delivered, on average, 22.59% each year for those 5 years.
If you’re wondering how NDQ stacks up against the powerhouse ETF, IVV, check out my IVV vs NDQ article.
When you look at these annualised or average returns, they consider years with both market downturns and upswings, capturing periods such as the market dips and surges seen in 2022 and 2023.
NDQ Top 10 Holdings
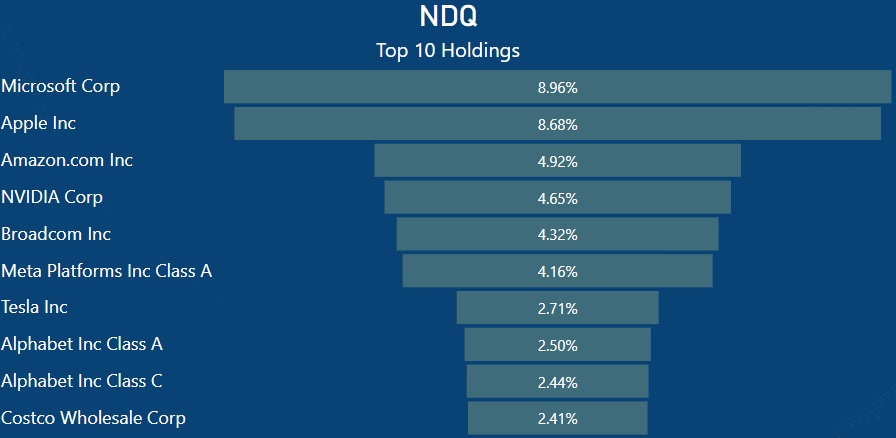
As expected, NDQ is heavily weighted in technology stocks. The NASDAQ 100 index comprises of the 100 largest non-financial companies listed on the NASDAQ stock exchange.
While this index allows for the inclusion of non-financial companies, a significant portion of the stocks listed are technology-based. When you invest in NDQ, you’re also investing in companies like Microsoft, which makes up 8.89% of the index, Apple at 8.68%, Amazon at 4.92%, and Nvidia at 4.65%.
In practical terms, a $1000 investment in NDQ would allocate approximately $89.60 to Microsoft stocks, $86.80 to Apple, $49.20 to Amazon, and $46.50 to Nvidia.
FANG Top 10 Holdings
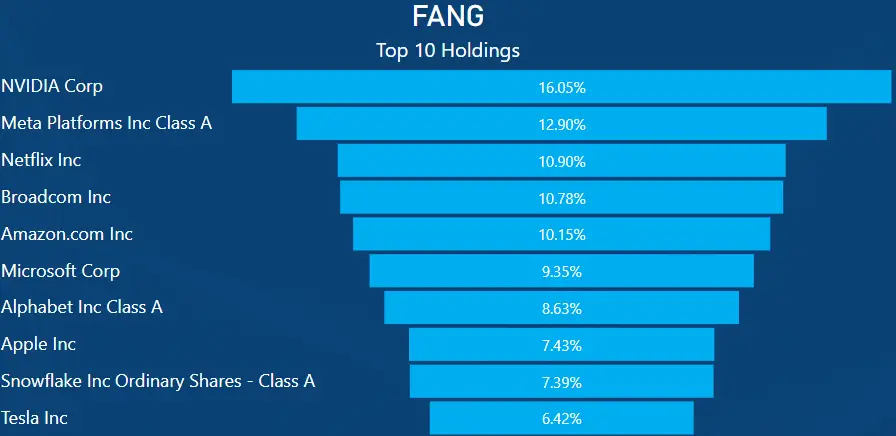
The top 10 holdings of FANG consist mostly of household names familiar to investors worldwide, with perhaps the exception of Broadcom and Snowflake.
Broadcom is a global technology company specialising in semiconductor and infrastructure software solutions for networking, wireless communication, broadband, and storage applications.
Snowflake, on the other hand, is a cloud-based data warehousing company offering a platform for storing, managing, and analyzing large volumes of structured and semi-structured data.
When comparing the holdings of NDQ and FANG, the top 10 companies are mirrored, with the exception of Costco and Alphabet Class C shares in NDQ, and FANG having Snowflake and Netflix within its ETF holdings.
Looking at the underlying holdings of FANG, Nvidia stands out as the largest company, with a 16.05% holding, followed by Meta with a 12.90% holding. Nvidia had an exceptional year in 2023, experiencing a 239% gain, and its year-to-date performance in 2024 stands at 81.71%.
When you invest in FANG, you gain exposure to all these companies. So, with a $1000 investment, you would own approximately $160.50 in Nvidia, $129.00 in Meta, and $109.00 in your favorite (or least favorite) streaming platform, Netflix.
NDQ vs FANG Top 10 Holdings As A Total Percentage Of ETF
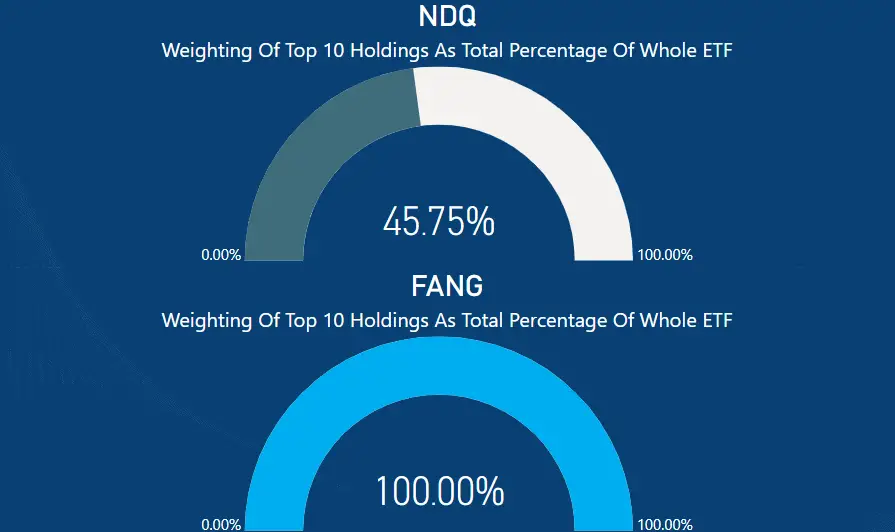
When comparing the two ETFs in terms of how their top 10 holdings make up the entire ETF, the comparison becomes somewhat skewed. FANG, as expected, is made up of just 10 companies, therefore the entire ETF is 100%.
NDQ, conversely, holds 101 equity holdings, with its top 10 holdings representing 45.75% of the entire ETF. This concentration is high, as 10% of the total stocks account for 45.75% of the ETF’s total weight.
Both NDQ and FANG are heavily concentrated within the tech sector.
NDQ vs FANG Market Cap
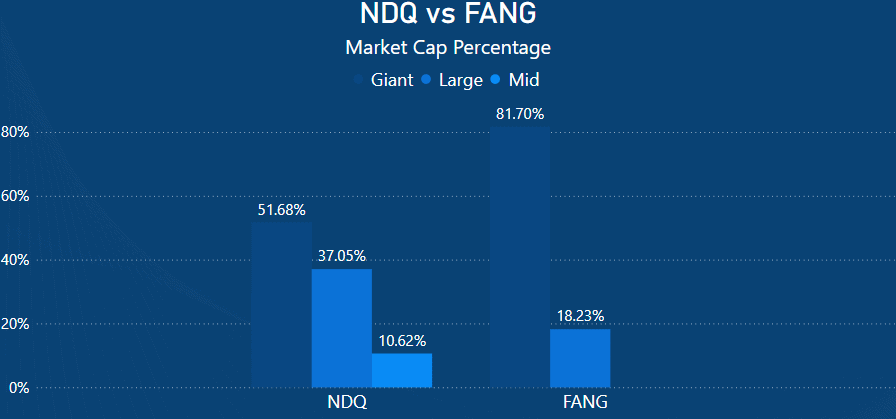
When comparing NDQ and FANG side by side, it is evident that FANG has the biggest overall weighting in giant cap stocks at 81.70%, compared to NDQ, which sits at 51.68%. This is to be expected considering that FANG has just 10 holdings with the likes of Apple, Meta, and Alphabet among them.
When looking at the large cap stocks, NDQ has the higher weighting at 37.05%, with FANG having half that at 18.23%. Again, this is to be expected with NDQ having 101 holdings overall.
Lastly, NDQ has 10.62% mid-cap stocks within its ETF, with FANG having no mid-cap-sized companies within its ETF.
Summary – All In or Diversify?
When making the decision between NDQ or FANG, the choice really comes down to whether you’re all in on technology, artificial intelligence, and communication-based shares. FANG is a highly concentrated ETF with just 10 holdings.
There is really nothing about FANG that provides any level of diversification considering both its underlying holdings and the number of them. NDQ, on the other hand, provides relative diversification in its 101 equity holdings, albeit with 50.40% of the ETF being in tech-related companies [3].
NDQ itself is not really a well-diversified ETF due to its technology heaviness, number of holdings, and the weighting of its top 10 within the overall ETF.
However, for the purposes of this piece, it really comes down to whether you want to add a tilt or satellite position to your investment portfolio.
Are you comfortable with just 10 companies within an ETF driving your portfolio growth, or would you prefer the likes of NDQ, which offers high-tech exposure to some of the largest global companies with a wider level of overall diversification?
This article does not serve as an endorsement or recommendation for products mentioned in the article. The information presented here is based on referenced sources and is accurate as of the date of 09 March 2024. Please note that these articles are written sometime before their publication date.
The information provided in this content is for informational purposes only and should not be considered as financial, investment, or professional advice. We recommend consulting with a qualified expert or conducting your own research before making any financial decisions.
The accuracy, completeness, or reliability of the information cannot be guaranteed, and the provider shall not be held responsible for any actions taken based on the information contained in this content.
References
- https://au.finance.yahoo.com/
- https://www.morningstar.com.au/
- https://www.betashares.com.au/fund/nasdaq-100-etf/
- https://www.betashares.com.au/about-us/
- https://www.globalxetfs.com.au/funds/fang/
- https://www.globalxetfs.com.au/about/
- IVV vs VGS – An Investor’s DilemmaConsidering Investments in VGS and IVV? Explore Their Key Similarities and Differences. Discover Why VGS Offers Greater Diversification.
- VGS vs QUAL: The Best Diversification ETF vs Quality IndexLast Updated on 4 May 2024 by Ryan Oldnall Investors seeking to gain exposure to international markets are…
- NDQ vs FANG: Which Tech ETF Is Right For You?Last Updated on 30 March 2024 by Ryan Oldnall In 2023, American Tech companies, particularly those investing in…
- NDQ vs VGS: Harnessing Tech Potential And Global OpportunitiesLast Updated on 30 March 2024 by Ryan Oldnall International investing has been profitable for Australian investors in…
- VAS vs IVV: Maximizing Growth Potential With ASX and S&P500Last Updated on 12 March 2024 by Ryan Oldnall The choice between investing in the Australian share market…