IVV vs VTS: Unveiling the Best ETF for Your Portfolio
Last Updated on 12 March 2024 by Ryan Oldnall
Considerable attention is given to investing in the US stock market, which has seen a total return annualized growth rate nearly double that of the Australian ASX over the last decade. It’s therefore no surprise that investing in the US has continued to capture attention.
The S&P 500 has delivered a 10-year annualized return of 16.40%, while the ASX200 has recorded a 10-year annualized return of 8.01% [1][2]. There’s a considerable debate on whether to invest in IVV or VTS, both representing investment opportunities in the US. But which one is right for you?
In this article, we will analyze the performance of both IVV and VTS using data from Yahoo Finance and Morningstar [3][4]. Additionally, we’ll explore the advantages and disadvantages of investing in both as it stands today.
IVV Review
The BlackRock iShares S&P 500 ETF, widely known as IVV, remains a favored option among investors seeking exposure to the U.S. stock market. It closely tracks the performance of the S&P 500 Index, encompassing the 500 largest and most influential American corporations.
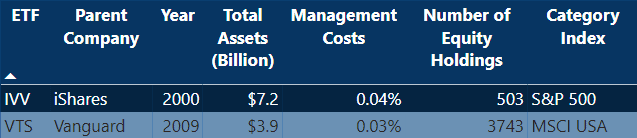
Introduced by the global investment management firm BlackRock in 2000, IVV has enjoyed significant success since its inception.
As of January 2024, Bloomberg reports that BlackRock manages assets totaling approximately $10 trillion, showcasing a remarkable increase of nearly a trillion dollars since March 2023 [5].
In 2018, IVV was domiciled in Australia, a strategic move that notably simplified the investment process for Australian investors by reducing administrative burdens like the W8-BEN form and offering improved tax advantages.
This distinction between IVV and VTS is pivotal and remains one of the primary reasons why many prefer IVV over VTS. Being domiciled in Australia streamlines the process of owning, buying, and selling ETFs.
Lastly, in December 2022, IVV underwent a 15:1 stock split, meaning investors received 15 ETFs for every IVV ETF held. Although a stock split may not lead to immediate profit or loss, its primary benefit lies in providing individual investors with increased liquidity and accessibility to the ETF.
VTS Review
Vanguard, a globally renowned investment management firm boasting a impressive track record, has wielded considerable influence in the Australian market since its establishment in 1996.
Serving over 50 million investors worldwide, Vanguard oversees a total of over A$10 trillion in assets, with VTS alone managing $3.9 billion [6].
Introduced in May 2009, Vanguard US Total Market Shares Index ETF, VTS offers investors exposure to approximately 4,000 companies listed in the United States, aiming to mirror the performance of the Center for Research in Security Prices (CRSP) US Total Market Index. [7].
A key distinction between VTS and most of the other ASX-listed ETFs is the country in which they are domiciled. VTS is domiciled in the US, a factor that alone discourages many investors from choosing VTS and leads them to consider alternatives like IVV, which concentrates on the S&P 500.
I won’t be diving into the nitty-gritty of domicile and taxes in this article. However, you can check out some great resources to learn more: Morningstar’s insights on Tax Implications of Overseas Investing and Owen Rask’s breakdown of USA domicile tax on BestETFs.
The VTS ETF is exposed to fluctuations in the value of the US dollar without hedging against the Australian dollar. This characteristic may appeal to investors who anticipate a long-term appreciation of the US dollar relative to the Australian dollar.
IVV and VTS ETF Management Fees
ETF management fees or management expense ratios are important. The ETFs themselves aim to track the index before taking into account fees, expenses and tax. Therefore, it is important to find ETFs that only track your desired index but do so at a decent cost.
When assessing the management fees of the two ETFs, VTS edges out IVV with a management expense ratio of 0.03%. That being said IVV itself has a highly competitive management expense ratio of 0.04%.
What this means in real terms is that for every $1000 you own, VTS will set you back $0.3, while IVV will cost you $0.4. I have previously covered the topic of Who Has The Lowest ETF Management Fees In Australia? where I focused only on Australian-domiciled ETFs.
IVV vs VTS Annualised Returns
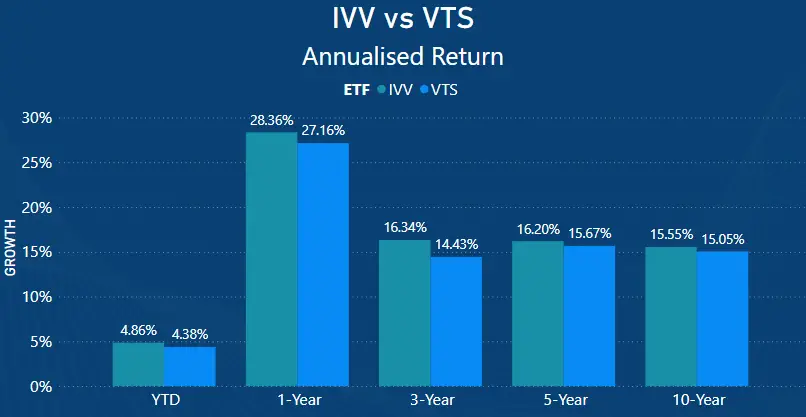
When comparing the average returns of both ETFs, their year-to-date (YTD) performance is very similar, with IVV producing a 4.86% return, ahead of VTS’ 4.38%.
Looking at the one-year performance, once again IVV comes out on top with a 28.36% return compared to VTS’ 27.16% one-year annualized return.
Turning to the three-year performance, IVV continues to outperform VTS with a 16.34% annualized return compared to VTS’ 14.43%. The annualized performance gap between IVV and VTS over the three-year period stands at 1.91% each year.
Over a five-year period, IVV produced a 16.20% 5-year annualized return, which was 0.53% better than VTS’ return of 15.67%.
Lastly, looking at the 10-year returns of both ETFs, both have delivered impressive returns above 15%. IVV returned 15.55% and VTS 15.05% on a 10-year annualized basis.
To illustrate the performance of these two ETFs, let’s use Morningstar’s 10-year performance growth charts. If you had invested $10,000 into IVV 10 years ago, that investment would now be worth $42,016 [3].
Comparatively, using the same 10-year performance investment growth chart for VTS, if you had invested that same $10,000 into VTS a decade ago, your investment would now be worth $40,389 [3].
Meanwhile, investing the same $10,000 in the Australian ASX over the same period would have yielded approximately $21,000 through ETFs like Ishares Core S&P/ASX 200 ETF, IOZ [3].
IVV Top 10 Holdings
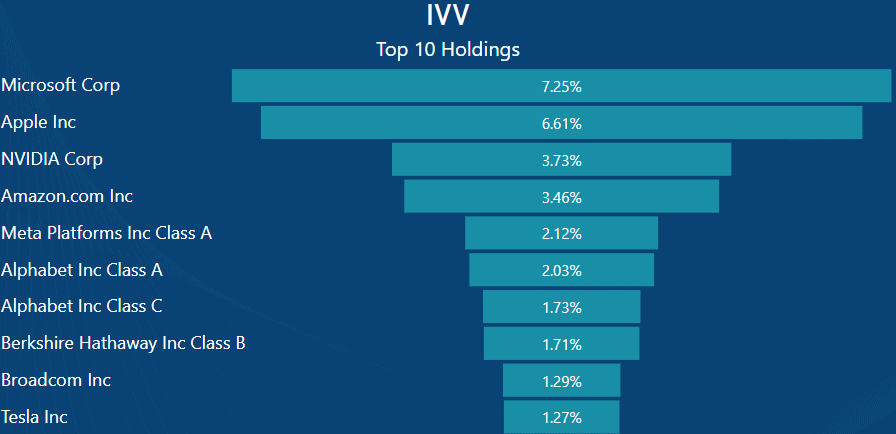
Examining the top 10 holdings of IVV reveals many familiar names, recognizable even to non-investors. Microsoft constitutes the largest portion of IVV at 7.25%, closely followed by Apple at 6.61%.
In practical terms, if you invested $1000 into IVV, you would have approximately $72.25 worth of Microsoft shares and $66.10 worth of Apple shares.
Other notable holdings in IVV include Google (Alphabet), which accounts for a combined 3.76% across their A and C class shares, as well as Warren Buffett’s Berkshire Hathaway at 1.71%.
VTS Top 10 Holdings
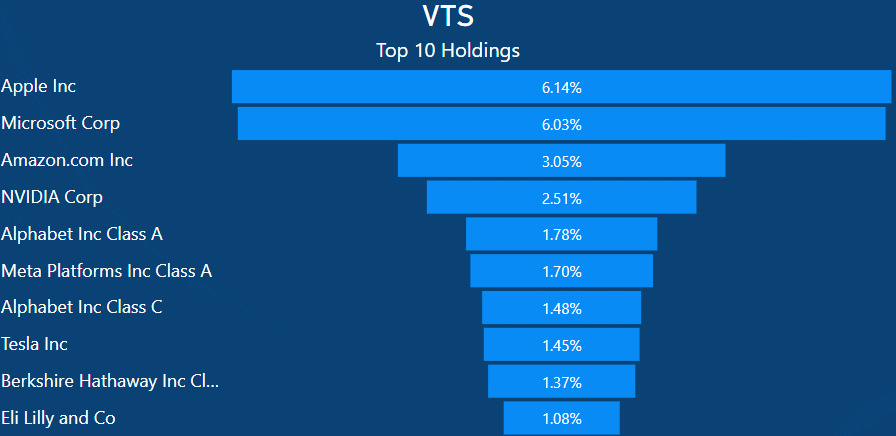
Comparing the holdings of VTS to those of IVV reveals a remarkably similar landscape, although with different weightings within the top 10.
For example, owning $1000 worth of VTS would mean approximately $61.40 invested in Apple shares, $60.30 in Microsoft shares, and $30.50 in Amazon shares.
While the top 10 companies differ slightly between the two, VTS includes Eli Lilly and Co. at the expense of Broadcom, which is included in IVV.
IVV vs VTS – Top 10 Holdings As Total Percentage of ETF
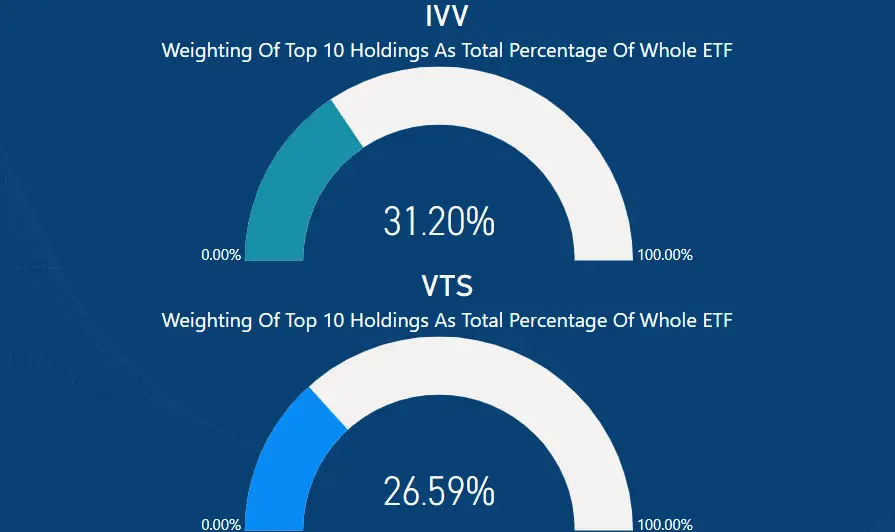
When reviewing the top 10 holdings in each ETF, it’s apparent that both are heavily influenced by the same stocks. IVV, with its strong emphasis on its 10 top holdings, carries a weight of 31.20%, while VTS has an overall weighting of 26.59%.
Despite VTS having around 3743 equity holdings, it still allocates a notable portion of its weighting to just 10 stocks. This is noteworthy considering VTS tracks the CRSP (Center for Research in Security Prices) Index.
The VTS ETF follows a market-cap weighted approach, wherein the weight of each stock in the portfolio is determined by its market capitalization. This results in a notable allocation to the top 10 stocks compared to the rest of the holdings.
VTS vs IVV – Market Cap Percentage
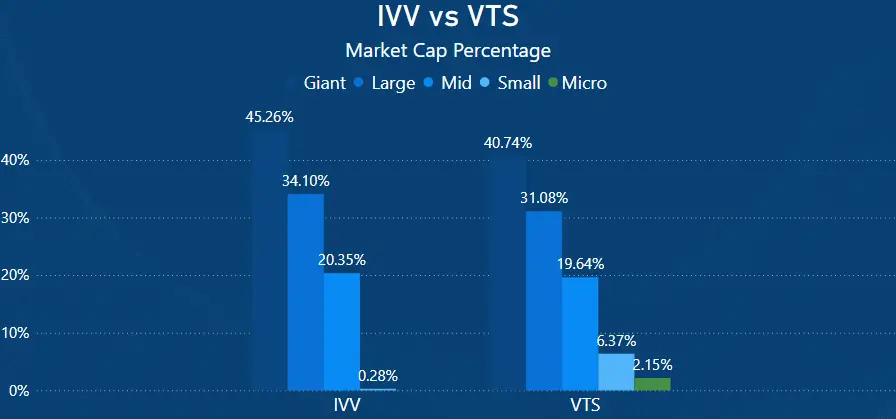
When reviewing the Market Cap percentages, it becomes apparent that IVV holds the highest weighting towards Giant and large market-cap companies, overall.
IVV maintains 45.26% in Giant and 34.10% in large-cap companies, totaling 79.36% of the entire ETF. A smaller portion is represented in mid-cap companies at 20.35%, with only 0.28% allocated to small-cap.
In contrast, VTS also has significant weightings towards Giant and large-cap companies, albeit to a lesser degree. VTS allocates 40.74% to Giant and 31.08% to large-cap companies.
However, disparities emerge in the mid to micro-cap distribution between VTS and IVV. VTS holds 19.64% in mid-cap, 6.37% in small-cap, and 2.15% in micro-cap. Notably, IVV does not include any micro-cap companies in its portfolio.
IVV vs VTS Sector Allocation
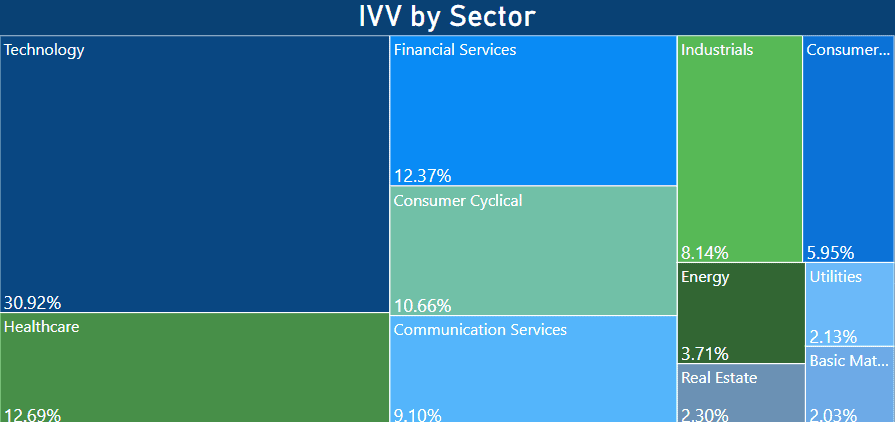
When analysing the different sector allocations, it’s no surprise to see that IVV is largely dominated by the technology sector, comprising 30.92% of its holdings.
Additionally, there are healthy allocations of 12.37% into financial services, 12.69% into healthcare, and 10.66% into consumer cyclical.
In the examples mentioned above, Microsoft, Apple, and NVIDIA fall under the technology category, while Amazon is classified under consumer cyclical, which includes companies producing non-essential goods and services.
Moreover, Berkshire Hathaway is categorized as financial services, while Eli Lilly and Co. is in the healthcare sector.
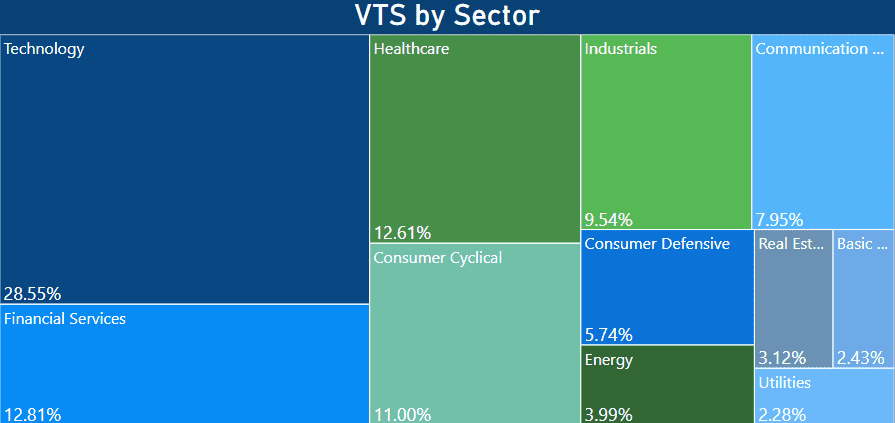
Comparing this to VTS, it also has a significant representation in the technology sector at 28.55%, with financial services at 12.81%, healthcare at 12.61%, and consumer cyclical at 11.00%.
Given that the underlying index is market-weighted, this distribution comes as little surprise. Other sectors represented include industrial, consumer defensive, energy, communication services, real estate, basic materials, and utilities.
Summary – Does Country Of Domicile Matter?
The decision to choose between VTS or IVV ultimately hinges on your individual goals and objectives as an investor. The appeal of owning the U.S. Total Market Shares index through VTS is very compelling for many.
However, one significant downside of owning VTS is its US domicile status. While the ETF is listed on the ASX, it’s essentially a cross-listing of Vanguard Total Stock Market Index Fund ETF (VTI) from the US.
On the other hand, IVV presents a compelling opportunity as one of the few ETFs offering concentrated exposure to the US market, specifically through tracking the S&P 500.
Building on previous comparisons in articles such as those contrasting IOO vs IVV and VGS vs IVV, it’s evident that while other ETFs provide access to the US S&P 500, none rival the comprehensive coverage offered by IVV.
While both IVV and VTS sport impressively low management expense ratios of 0.04% and 0.03% respectively, the tax convenience with an Australian-domiciled ETF like IVV gives it the edge over VTS, in my view.
This article does not serve as an endorsement or recommendation for products mentioned in the article. The information presented here is based on referenced sources and is accurate as of the date of February 16, 2024. Please note that these articles are written sometime before their publication date.
The information provided in this content is for informational purposes only and should not be considered as financial, investment, or professional advice. We recommend consulting with a qualified expert or conducting your own research before making any financial decisions.
The accuracy, completeness, or reliability of the information cannot be guaranteed, and the provider shall not be held responsible for any actions taken based on the information contained in this content
- https://www.spglobal.com/spdji/en/indices/equity/sp-500/#overview
- https://www.spglobal.com/spdji/en/indices/equity/sp-asx-200/#overview
- https://www.morningstar.com.au/
- https://au.finance.yahoo.com/
- https://www.bloomberg.com/news/articles/2024-02-09/nycb-jumps-as-ceo-board-buy-shares-after-4-billion-selloff
- https://www.vanguard.com.au/corporate/
- https://www.vanguard.com.au/personal/invest-with-us/etf?portId=0970