IOO vs IVV: iShares ETFs Go Head-to-Head
Last Updated on 20 February 2024 by Ryan Oldnall
 The iShares S&P 500 ETF, IVV, and the iShares Global 100 ETF, IOO, are hugely popular with Australian Investors seeking to get international exposure. Australian investors choose these ETFs for their exceptional long-term historical performances.
Over the past decade, the US stock market has demonstrated impressive growth, even in the face of challenges like the Covid-19 pandemic.
Despite a significant dip in early 2020, the S&P 500 has delivered a remarkable 10-year total return of 11.91% as of September 29, 2023 [1].
Likewise, IOO, which tracks the S&P Global 100 Index, has achieved a 10-year return of 10.46% as of September 29, 2023 [2].
In this article, we will conduct a comparison of these two popular ETFs: IOO vs IVV. Our analysis will provide valuable insights into these ETFs to assist you in determining which one better aligns with your investment objectives.
Many investors often wonder whether to include IOO or IVV in their portfolios, so let’s compare the two iShare ETFs.
IVV ETF and IOO ETF Review
The BlackRock iShares S&P 500 ETF, commonly referred to as IVV, stands as a popular option among investors seeking to invest in the U.S. stock market.
IVV closely tracks the performance of the S&P 500 Index, which comprises of the largest 500 and most influential American corporations.
Introduced by BlackRock in the year 2000, a globally renowned investment management firm, IVV has enjoyed fantastic success. As of March 2023, BlackRock manages assets totaling approximately $9.09 trillion [3].
In 2018, IVV’s was domiciled to Australia, simplifying the investment process for Australian investors significantly.
This shift in domicile streamlined tax-related documentation and paperwork, providing substantial advantages to investors based in Australia.
Furthermore, in December 2022, IVV underwent a 15:1 stock split, meaning that for every IVV share held, investors received 15 additional shares.
Although this action does not result in immediate profit or loss, the primary benefit of a stock split is that it enables individual investors to acquire more shares of the ETF at a lower cost.
Similar to IVV, the iShares Global 100 ETF, IOO also comes under Blackrock and iShares. iShares is a collection of exchange-traded funds managed by BlackRock.
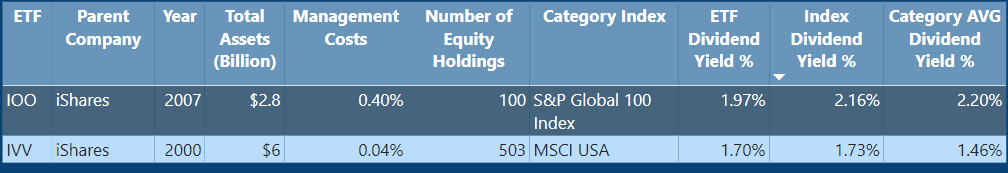
IOO ETF was initially introduced in Australia on October 10, 2007, and it boasts a history spanning 16 years. It offers investors a diversified portfolio of prominent global companies and currently manages $2.8 billion in assets within the ETF [4].
Investors who opt for IOO can achieve diversification across various countries and industries, reducing the risks associated with individual stocks.
This ETF provides exposure to leading multinational corporations, making it an attractive option for those seeking long-term investment growth.
ETF Management Fees
ETF management fees represent the annual expenses associated with the operation and promotion of an ETF, and they have a direct impact on your overall investment returns.
It’s important to take into account the cost of fees in an ETF, as lower fees ensure that a larger portion of your returns remain with you.
ETFs are often favored for their cost-efficiency when compared to other investment options. To understand the fee structure, it’s essential to review an ETF’s Product Disclosure Statement (PDS).
In the case of IVV, it has an exceptionally low ETF expense ratio of 0.04%. For example, this means that with a $10,000 investment in IVV ETFs, your annual fee would be just $4.
On the other hand, IOO carries a higher fee of 0.40%. This translates to an annual fee of $40 on a $10,000 investment in IOO.
Considering the value that each ETF provides, some investors may still find this fee to be quite reasonable.
IVV Dividend History
The present dividend yield (distribution) for IVV stands at 1.70%, slightly below the index’s 1.73% dividend yield. This distribution is disbursed quarterly.
IOO Dividend History
The present dividend yield for IOO is currently at 1.97%, and these dividends are distributed semi-annually. This dividend yield is slightly lower than the index yield of 2.16%.
For Australian investors, these yields may appear somewhat modest, especially when compared to A200 vs VAS yields.
This discrepancy can be attributed primarily to the fact that American companies generally do not distribute dividends to the same extent as Australian companies do.
IVV vs IOO – 5 Year Annual Performance Comparison
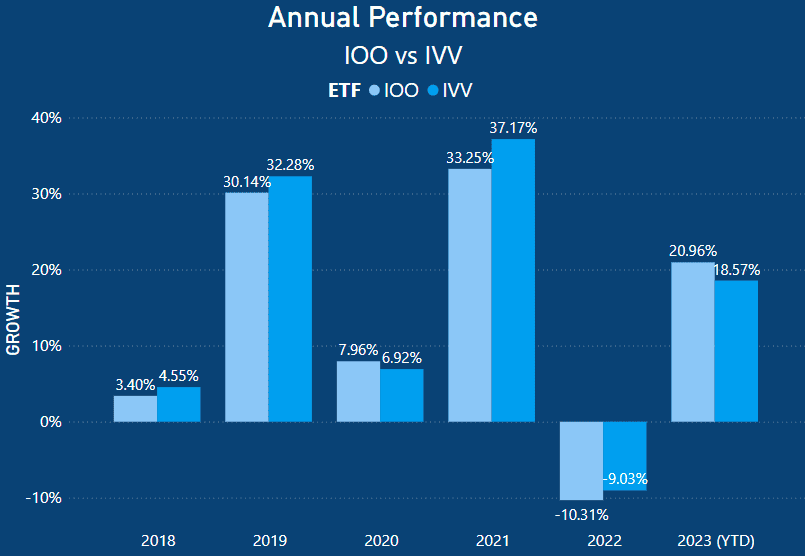
When assessing the performance over the past 5 years, both IVV and IOO have delivered strong results. In 2018, both experienced lower returns, with IVV returning 4.55% and IOO 3.40%.
In 2019, both displayed exceptional returns, with IVV outperforming IOO, achieving a return of 32.28%. This performance was 2.14% better than that of IOO, which yielded 30.14%.
In 2020, at the height of the COVID-19 pandemic, both ETFs experienced a decline before rebounding in 2021. IVV once again exhibited stronger performance with a 37.17% return, surpassing IOO by 3.92%, as IOO returned 33.25%.
In 2022, market conditions deteriorated due to rising inflation, heightened global recession risks, and the conflict in Ukraine. Since both IVV and IOO are exposed to global companies, they both incurred substantial losses.
In 2023 year-to-date (YTD), IOO has shown robust growth with a return of 20.96%, surpassing IVV’s return of 18.57%. Later in this article, we will explore the potential performance reasons why IOO has outperformed IVV in 2023.
ETF Holdings
ETFs are comprised of a collection of individual stocks, serving as the core assets within the ETF. The composition of an ETF primarily depends on the index it aims to replicate, its investment objectives, and occasionally, specific screening criteria like ESG considerations.
In certain cases, some ETFs may allocate larger portions of their investments to specific stocks. This holds true for both IOO and IVV ETFs.
In the case of IVV, despite having more than 1455 equities, a significant portion of its investments is concentrated in a select few stocks.
Some ETFs adopt an equal-weighting strategy, where all the underlying stocks in the ETF are given equal importance. This ensures that if one stock outperforms while others underperform, a process known as “rebalancing” occurs to maintain equal weight.
An example of such an Australian ETF is Vaneck’s MVW. I explore this topic in greater detail in my review comparing MVW vs VAS – What Is The Best Australian ETF?
The findings from this analysis may come as a surprise.
IOO Holdings
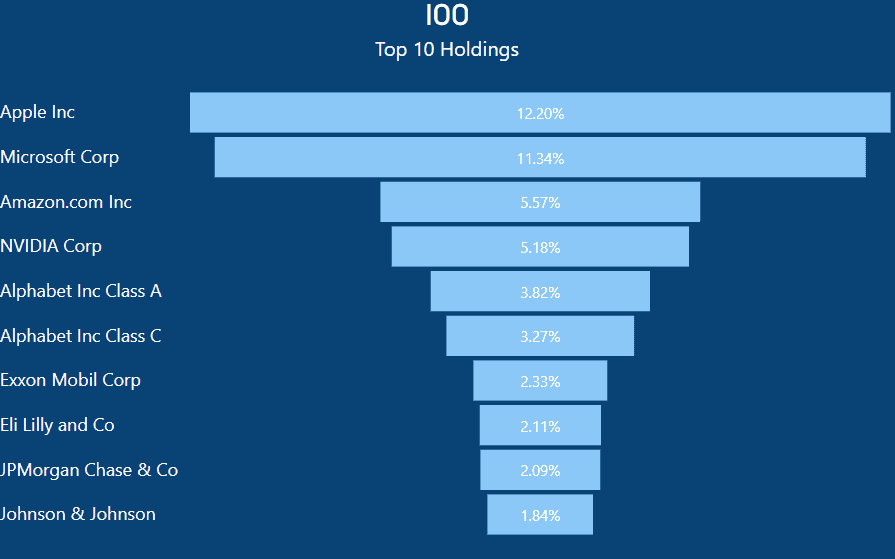
IOO holds substantial investments in various American companies, with Apple being the top contender. It allocates 12.20% of its portfolio to Apple, which translates to owning $122.00 of Apple stock for every $1000 invested in IOO.
Similarly, Microsoft constitutes 11.34% of IOO’s holdings. Just as with Apple, if you had $1000 invested in IOO, you would possess $113.40 worth of Microsoft shares.
Given the substantial market capitalization of U.S. tech stocks, it’s not surprising that they maintain a prominent presence within the IOO ETF.
IVV Holdings
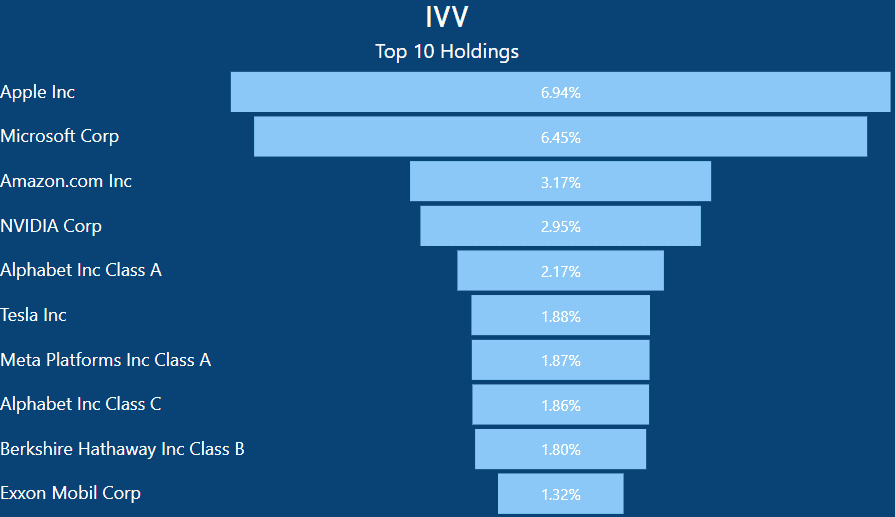
Similar to IOO, IVV also has a notable stake in Apple, although to a lesser extent. If you were to invest $1,000 in IVV, you would hold approximately $69.40 worth of Apple shares.
Similarly, like IOO, IVV also has a significant investment in Microsoft. If you had $1,000 invested in IVV, you would then have $64.50 worth of Microsoft shares.
It’s not surprising that the top 10 holdings are very similar between the two ETFs. The top 5 holdings are identical, with companies like Meta and Tesla only included in IVV.
Both IVV and IOO include many of the same technology-related stocks. U.S. technology companies represent a significant portion of both of these ETFs due to their significant market caps.
IVV vs IOO – Top 10 Holdings As Total Percentage of ETF
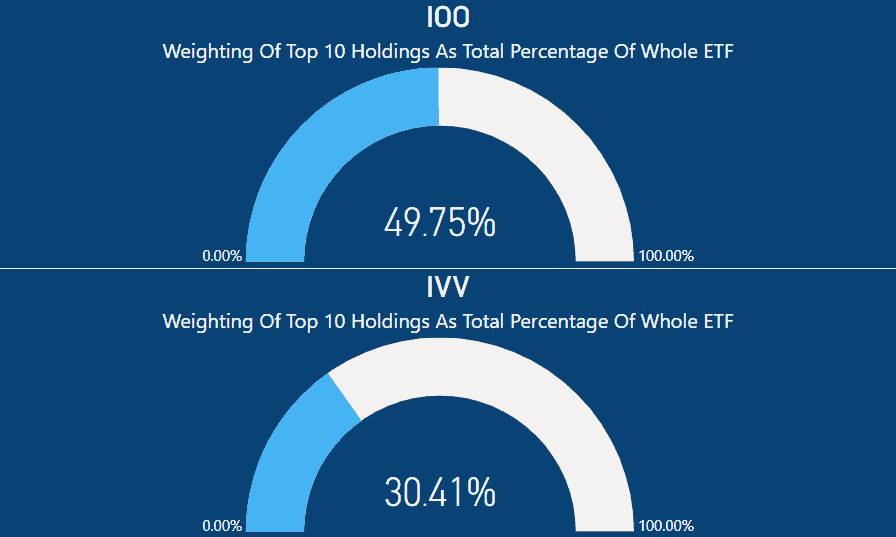
When looking at the top 10 holdings in each ETF, each is heavily weighted by the top 10 stocks. In the case of IOO, the top 10 shares represent a significant 49.75% of the entire ETF’s portfolio.
This is somewhat surprising, considering that IOO only invests in the top 100 global companies. Consequently, the remaining 90 companies account for the remaining 50.25% of the ETF.
Similarly, like IOO, IVV also carries substantial weight in its top 10 largest companies. The top 10 holdings constitute 30.41% of the total ETF.
With IVV encompassing a total of 503 equities, this means that the remaining 493 stocks make up the remaining 69.59%.
IOO vs IVV – Market Cap Percentage
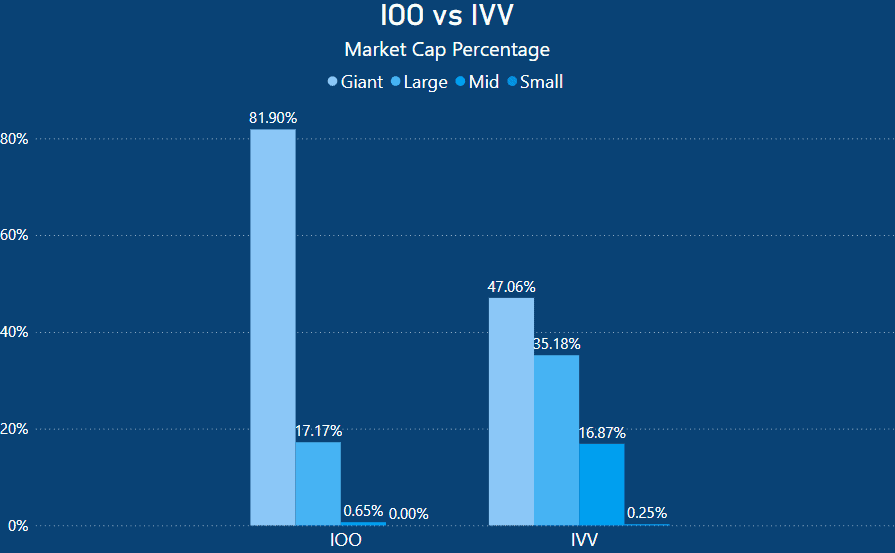
When examining the portfolios of both IOO and IVV, it becomes clear that they allocate significant portions to large-cap and giant corporations.
Once again, it’s not surprising that a substantial majority of IOO is comprised of giant market cap companies, considering that the ETF is designed to represent the top 100 global businesses.
In contrast, IVV has 47.06% of its investments in giant market cap companies and 35.18% in large market cap companies. Consequently, a substantial portion of both ETFs is directed toward well-established corporate giants known for their stability.
As a result, it’s highly unlikely for either ETF to have substantial initial positions in emerging companies that may one day become the next Tesla, Apple, or Google. These iconic firms typically started as small enterprises and gradually expanded.
Within the scope of these ETFs, such companies would only represent a small fraction of the overall investment until they achieve a significant market presence and attract substantial investments.
IOO vs IVV – Weighting by Continent
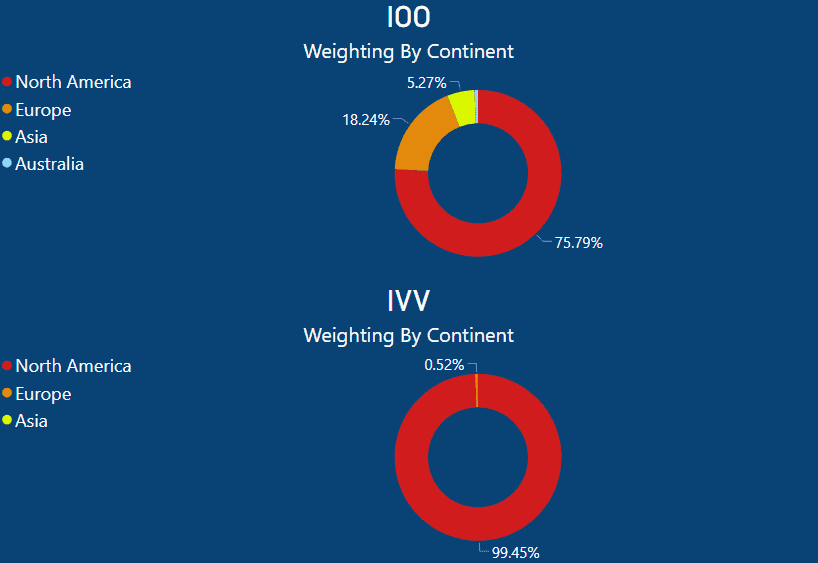
When analyzing IOO and IVV in terms of their continental holdings unsurprisingly they are very different. IOO is predominantly composed of North American companies, accounting for 75.79% of its holdings, while IVV is obviously even more heavily concentrated in North America at 99.45%.
IOO allocates 18.24% of its investments to European companies, 5.27% to Asian countries, and a minimal 0.07% to Australia. In contrast, IVV allocates just 0.55% of its holdings to European and Asian-related companies.
If you are looking for a more diversified portfolio I have also reviewed IVV vs VGS in my article, IVV vs VGS – An Investor’s Dilemma, and IOO vs VGS, in my article, IOO vs VGS: Which Global ETF Is Right For You?
Summary – Should You Hold IOO or IVV, or Both?
IOO and IVV are two very different ETFs with great historical performances. IOO follows the S&P Global 100 Index, meaning it holds the largest 100 companies globally.
Conversely, IVV follows the S&P 500 so has the largest 500 US Shares. Both IOO and IVV make substantial investments in companies such as Apple, Microsoft, Amazon, Nvidia, and Alphabet (Google).
IOO maintains a substantial 75.79% exposure to the North American stock market. Consequently, any developments, whether positive or negative, in these markets tend to exert a more significant influence compared to fluctuations in the Asian or European markets.
IVV on the other hand also has a significant weighting in tech stocks, as well as, shares such as Warren Buffet’s Berkshire Hathaway, and Tesla.
So let’s answer the questions, IOO or IVV?
I am a big fan of both IOO and IVV for different reasons. IVV offers fantastic exposure to the broader US market and for many people, would serve as a core element of their ETF portfolio.
IOO provides good exposure to the both US market and the wider global market, investing in the world’s largest corporations.
However, it’s unlikely to be a core holding in an investor’s portfolio due to its high concentration in select shares as previously demonstrated.
So, can you or should you hold both IVV and IOO?
Like all financial decisions, this depends on your individual objectives, goals, and financial circumstances.
However, to illustrate, if you were to evenly allocate $5,000 to each ETF, creating a 50/50 split, the top 5 holdings, which include Apple, Microsoft, Amazon, Nvidia, and Alphabet Class A, would make up 29.90% of your overall portfolio.
This means that nearly $3,000 of your $10,000 investment would be allocated to just 5 companies.
On the flip side, investing solely in IOO would expose you to 38.11% of these same top 5 stocks. This highlights the highly personal nature of this decision, which should be guided by your investment objectives, goals, and other portfolio holdings.
Therefore, holding both IVV and IOO is still very possible, but it will depend on an individual’s risk appetite and whether they are comfortable with an investment portfolio that could be highly concentrated in a handful of shares, all within the same tech space.
-
- https://www.spglobal.com/spdji/en/indices/equity/sp-500/#overview
- https://www.spglobal.com/spdji/en/indices/equity/sp-global-100/#overview
- https://www.morningstar.com.au/investments/security/NYSE/BLK
- https://www.blackrock.com/au/individual/products/273428/ishares-global-100-etf
This article does not serve as an endorsement or recommendation for products mentioned in the article. The information presented here is based on referenced sources and is accurate as of the publication date of October 2, 2023.