A200 ETF Review: Exploring the Lowest-Cost ASX ETF
Last Updated on 20 February 2024 by Ryan Oldnall
Betashares Australia 200 ETF (ASX:A200) mirrors the S&P/ASX 200 index’s performance, overseeing $3.5 billion in assets, and providing broad exposure to Australia’s top 200 listed companies[1].
In this review, we will analyze the performance of the BetaShares ETF A200 and compare it to the ASX 200.
What is the A200 ETF?
The A200 ETF offers a budget-friendly investment opportunity with a highly competitive ETF management fee of 0.05%. It functions as an exchange-traded fund that tracks the S&P ASX 200 index.
This index is composed of the 200 largest Australian companies, chosen based on their market capitalization. It includes a wide variety of ASX-listed shares, encompassing sectors like banking, mining, health care and industry.
A200 ETF Chart & A200 ETF Share Price
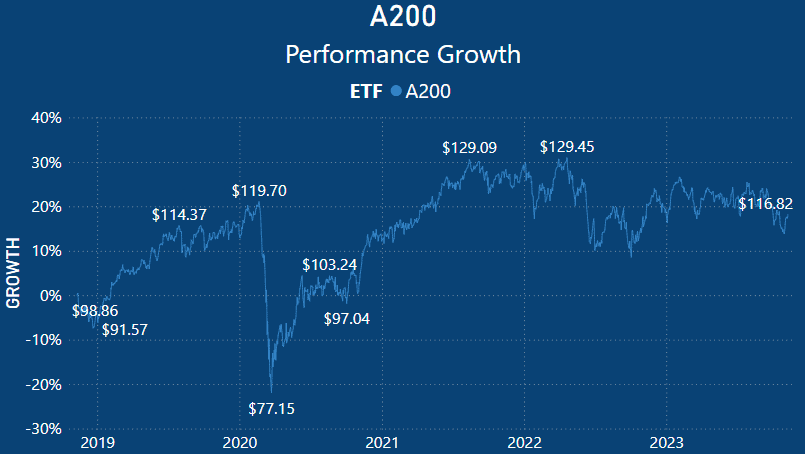
The A200 ETF has experienced a significant increase in its share price over the last five years. It faced a decline starting in late 2018, shortly after its launch in May 2018. The decline in 2018 extended into the early part of 2019.
Following this initial decline, the ETF’s share price displayed substantial growth, reaching a peak of approximately $119.70 in early 2020.
The sharp drop in the ETF’s share price can be attributed to the Covid-19 pandemic, causing it to hit a low point of around $77.15. Throughout 2020, it made a decent recovery but only partially regained ground from its starting point that year.
In 2021, the A200 ETF’s share price exhibited substantial growth, driven by robust performance in the Australian economy. Australia benefited from record-low interest rates, strong consumer confidence, and increased spending.
However, this positive trend and consumer confidence did not extend into 2022 and 2023. With rising levels of consumer debt due to record-low interest rates, increasing inflation, and global conflicts, the A200 ETF’s price and performance have largely remained stagnant.
A200 ETF Share Performance
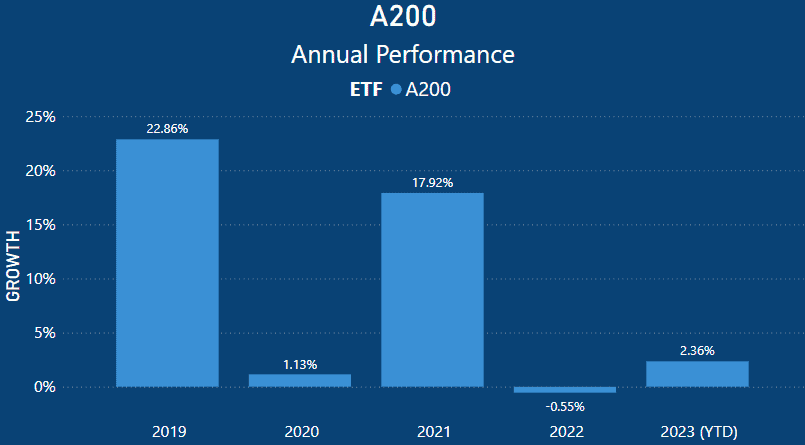 When examining the annualized return of the A200 ETF, you can clearly observe the growth years of the A200 ETF. It’s important to note that 2018 was not included in my analysis because A200 ETF did not have a full year’s worth of comparable data.
In A200’s first full year, which was 2019, it achieved significant gains at 22.86%. However, the emergence of Covid-19 in the world and Australia in 2020 resulted in a meager performance return of 1.13%.
All things considered, investors can take comfort in this performance, especially given the sharp decline in the ETF’s price.
Moving into 2021, the A200 ETF had another outstanding year, delivering a return of 17.92%. However, it has been followed by some lackluster performances since.
In 2022, the A200 ETF actually experienced a decline of -0.55%, and in the year-to-date (YTD) for 2023, A200 has a performance return of 2.36%.
A200 ETF Average Return
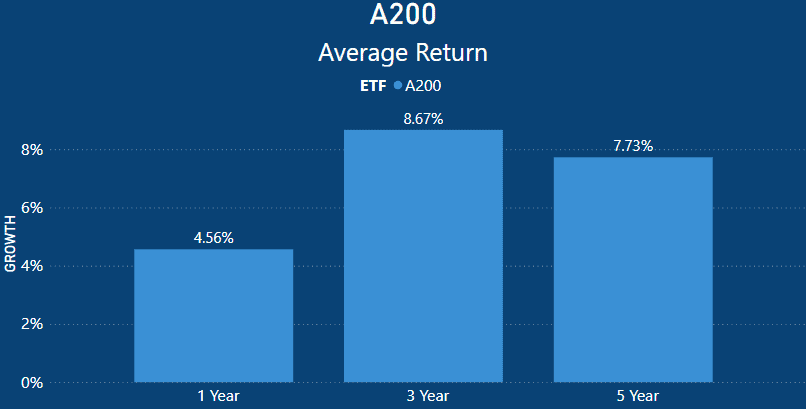 When analyzing A200’s average returns, it becomes evident that the 1-year average return stands at 4.56%. This is primarily due to the relatively lackluster performances observed in both 2022 and 2023.
The 1-year average return is slightly higher than the S&P/ASX 200 index’s total return of 4.35% [2].
Expanding the evaluation to a 3-year timeframe, A200’s average return amounts to 8.67%. This surpasses the S&P/ASX 200’s annualized total return of 7.50%. The A200 ETF outperformed the index by 1.17% [2].
Over a 5-year period, the A200 ETF achieved an average return of 7.73%. This commendable return was marginally higher by 0.01% compared to that of the index, and it exceeded the ASX return of 7.44% by 0.29%.
Since A200 was introduced only on May 8, 2018, it does not have a 10-year average return like other ETFs.
A200 ETF Dividends
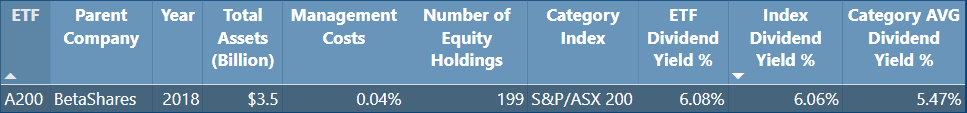 The A200 boasts an average dividend yield of 6.08%, and these dividends are distributed quarterly. On 17/10/2023, the dividend distribution per ETF was $1.71, surpassing the index average, which yielded 6.06%.
Furthermore, A200’s dividend yield percentage was higher than the category average. The category’s average stood at 5.47%, which was 0.61% lower than the A200 ETF’s dividend yield.
A200 ETF Holdings
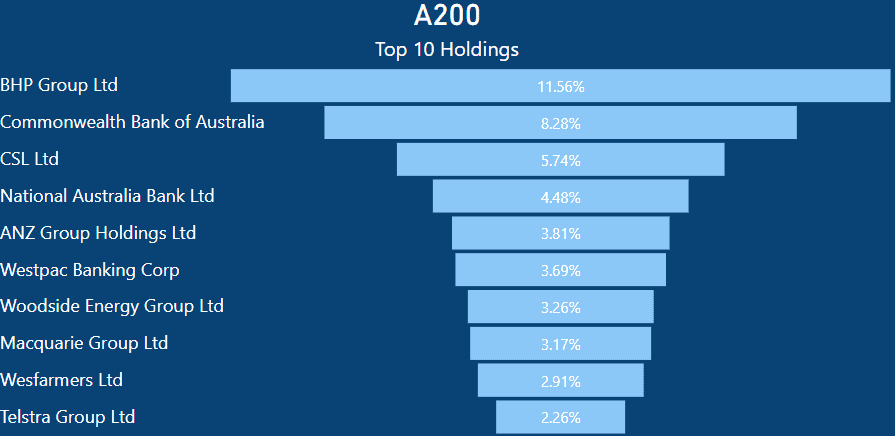 A200 maintains significant positions in some of Australia’s largest publicly traded companies, which is a typical characteristic of ASX 200 tracking ETFs.
The top three holdings in A200 are BHP, CBA, and CSL (Commonwealth Serum Laboratories), which have traditionally been prominent in many ASX tracking ETFs.
BHP holds a market capitalization of $229.46 billion [3], CBA stands at $169.76 billion [4], and CSL is valued at $121.80 billion. Collectively, these three companies account for over $521.02 billion in market capitalization.
Consequently, A200 allocates 11.56% of its holdings to BHP Group, an additional 8.28% to CBA, and 5.74% to CSL. These three companies alone make up 25.58% of the entire ETF.
Therefore, a quarter of your investment in A200 is concentrated in just these three companies.
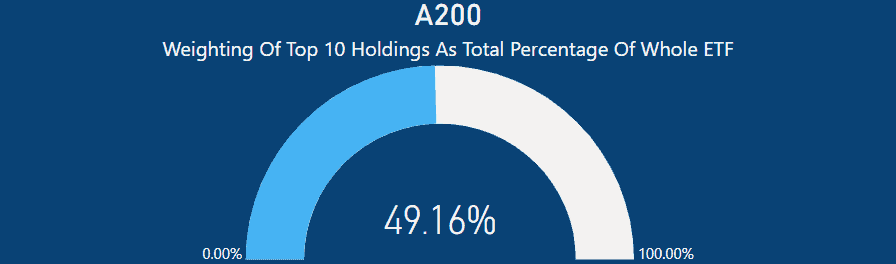 Moreover, when you analyze he top 10 holdings as a collective percentage of the ETF, these holdings together account for 49.16%. Since A200 tracks the S&P/ASX 200, it currently includes 199 equities. This means that just 10 companies represent nearly half of the ETF’s composition.
This concentration of top holdings is a common feature in the ASX 200 ETF landscape, as many competitors share similar or identical holdings. The primary distinction often lies in the weighting within the portfolio itself.
I observed this same trend in my ,VAS ETF Review, which tracks the largest 300 companies on the ASX.
From the current A200 holdings, we can see that nearly 50% of the overall performance is influenced by these 10 holdings, with 5 of them being banks.
Consequently, the ETF’s underlying performance is significantly impacted by the performance of these individual companies.
Summary – Is A200 ETF A Good Investment
The A200 remains a popular choice among investors looking to gain exposure to Australia’s largest companies, primarily because of its highly competitive ETF management fee, which stands at just 0.04%.
This ETF provides a dependable investment option, demonstrating consistent historical performance and a strong correlation with the S&P/ASX 200 index it aims to replicate.
The main goal of ETFs that track an index is to capitalize on their broad diversification. I’ve thoroughly examined various ETF comparisons that follow the same index, and the A200 doesn’t differ significantly from other ETFs in this category.
I’ve extensively covered these comparisons in my head-to-head reviews of ASX 200/300 tracking ETFs.
- https://www.betashares.com.au/fund/australia-200-etf/
- https://www.spglobal.com/spdji/en/indices/equity/sp-asx-200/#overview
- https://www.google.com/finance/quote/BHP:ASX
- https://www.google.com/finance/quote/CBA:ASX
- https://www.google.com/finance/quote/CSL:ASX
This article does not serve as an endorsement or recommendation for products mentioned in the article. The information presented here is based on referenced sources and is accurate as of the date of November 9, 2023. Please note that these articles are written sometime before their publication date.
The information provided in this content is for informational purposes only and should not be considered as financial, investment, or professional advice. We recommend consulting with a qualified expert or conducting your own research before making any financial decisions.
The accuracy, completeness, or reliability of the information cannot be guaranteed, and the provider shall not be held responsible for any actions taken based on the information contained in this content.